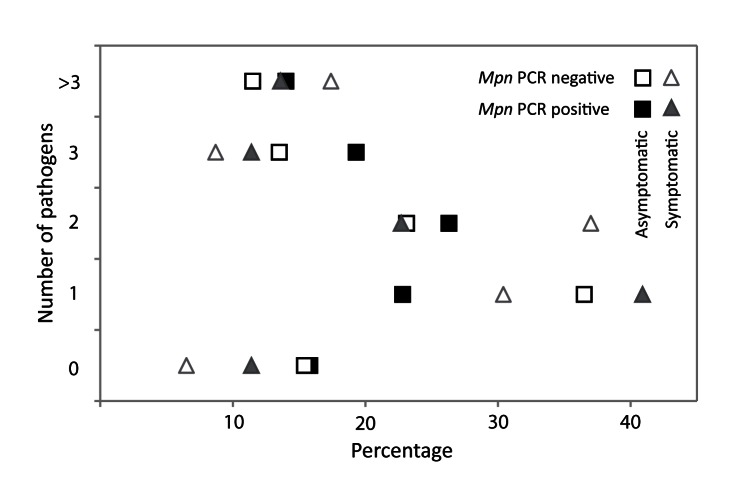
Figure 6. Number of detected viral and bacterial pathogens.
The dot plot shows the percentages of participants with 0, 1, 2, 3, or >3 pathogens present in the URT. On the x-axis the percentages are shown, on the y-axis the number of pathogens is shown. The filled and open triangles show respectively M. pneumoniae (Mpn) PCR-positive symptomatic children (n = 44) and M. pneumoniae PCR-negative symptomatic children (n = 46). The filled and open squares show respectively M. pneumoniae PCR-positive asymptomatic children (n = 57) and M. pneumoniae PCR-negative asymptomatic children (n = 52).

