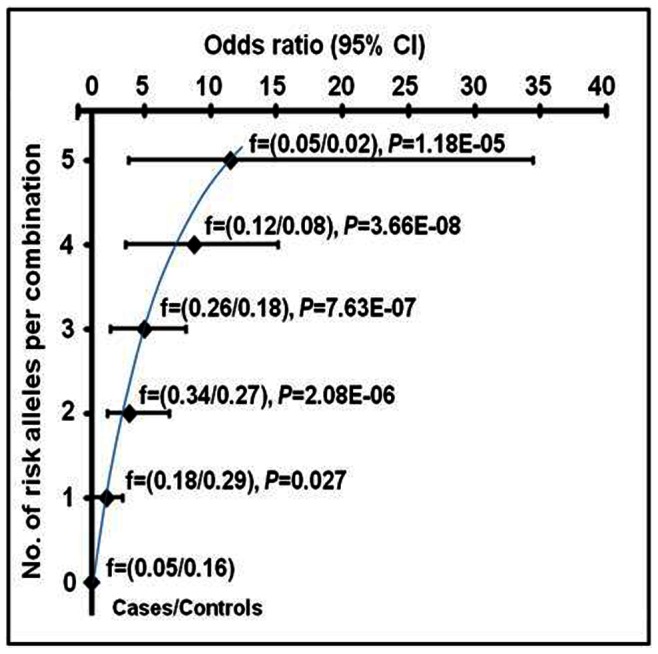
Figure 1. Interacted-genotypes carrying varied number of risk alleles of the 3-locus best model in hypertension susceptibility.

The MDR model consisted of the SNPs FTO, rs8050136C/A and GNB3, rs1129649T/C and rs5443C/T. Stratification was done on the basis of interacted-genotypes carrying risk alleles from 0 to 5. f, represents the frequency of the risk alleles in an interacted-genotypes. P-value and OR at 95% CI were calculated after adjustment for age, gender, BMI, alcohol, smoking, triglyceride and cholesterol using multivariate logistic regression analysis. The threshold P value was (0.05/6) = 0.008.
