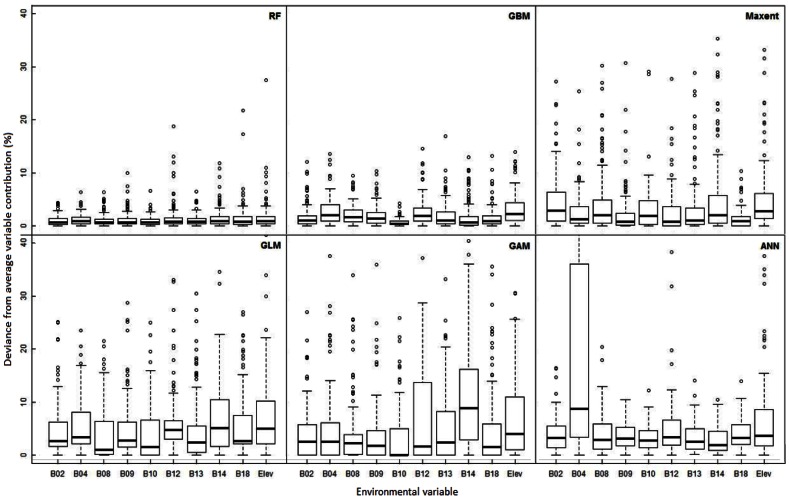
Figure 3. Consistency of the variables’ contribution to the model.
Variability of the contribution of each environmental variable (i.e. deviance from the average variable contribution to the model) for each algorithm. In the Y axis higher deviance represents a lower consistency in the contribution values given by the algorithm to the different variables across runs. The values for variable “B04” in the ANN algorithm go to 80% and other variables present outliers going beyond the 40%, however, for plotting convenience we show only the deviance up to the 40%. See Table 1 and Tables S8 and S9 for further statistical information.

