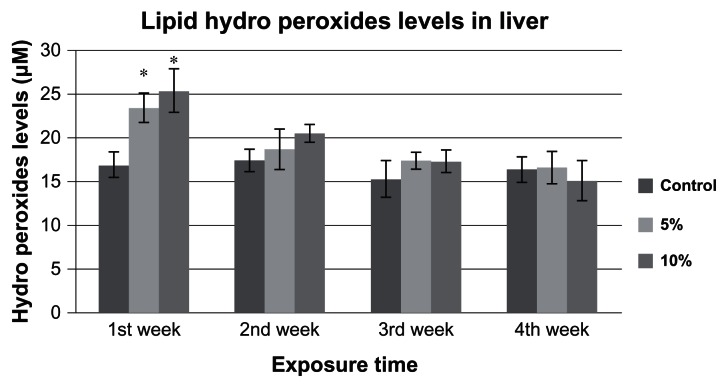
Figure 1.
LHP levels in Carassius auratus liver exposed to 5% and 10% of 96 hr LC50 Cr (VI) for four weeks.
Notes: Each point represents a mean value and standard deviation of three replicates. The LHP levels were 16.9 ± 3.0, 17.4 ± 3.0, 15.2 ± 3.0 and 16.3 ± 2.0 μM in control group; 23.4 ± 1.0, 18.6 ± 2.0, 17.3 ± 0.0 and 16.6 ± 1.0 μM in 5% of 96h-LC50; and 25.3 ± 2.0, 20.4 ± 1.0, 17.2 ± 1.0 and 15.0 ± 2.0 μM in 10% of 96h-LC50-exposed fish for Weeks 1, 2, 3, and 4, respectively. Both 5% and 10% 96h-LC50 concentrations induced an increase in LHP levels during Week 1. *indicates significantly different from the control according to DUNNETT’s multiple comparison test.

