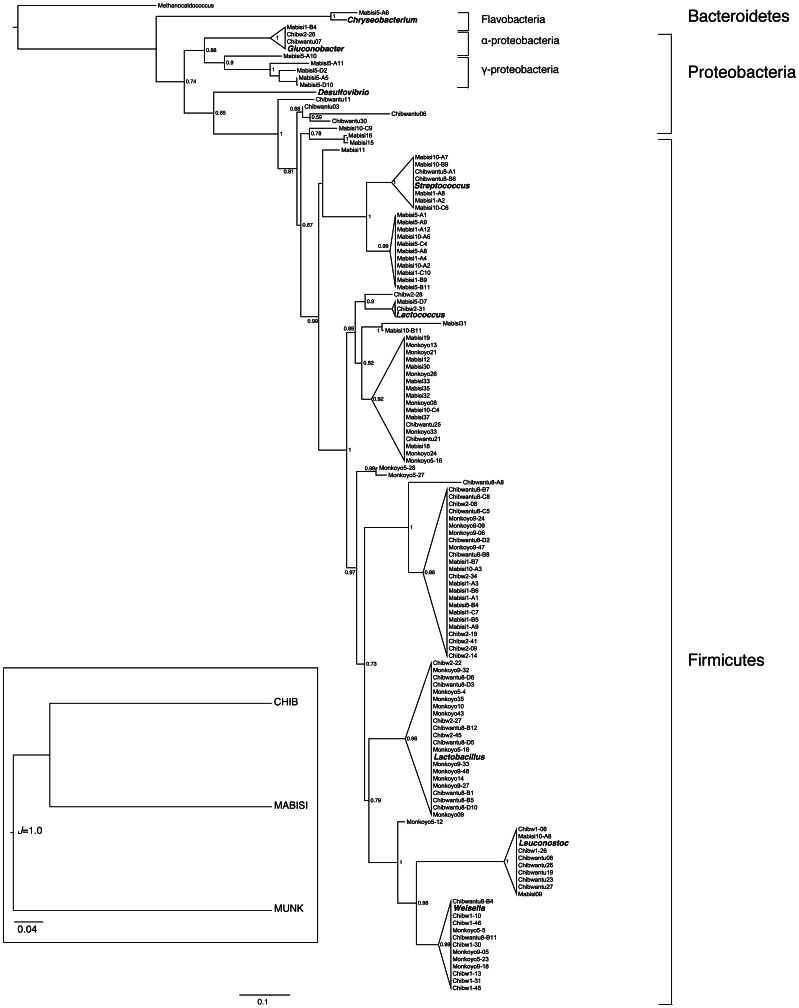
Figure 3. Phylogenetic tree.
Maximum likelihood tree of bacterial 16S rRNA gene sequences. Triangle heights are proportional to the number of sequences. Numbers adjacent to each node represent aLRT statistics (SH-like supports). Scale bar shows branch lengths (expected number of substitutions per site). See Tables 2 and 3 and the Table S1 for full strain details. Several known strains (from the NCBI database are shown in bold). The inset shows a cluster analysis based on the product type using all strains in the phylogeny.

