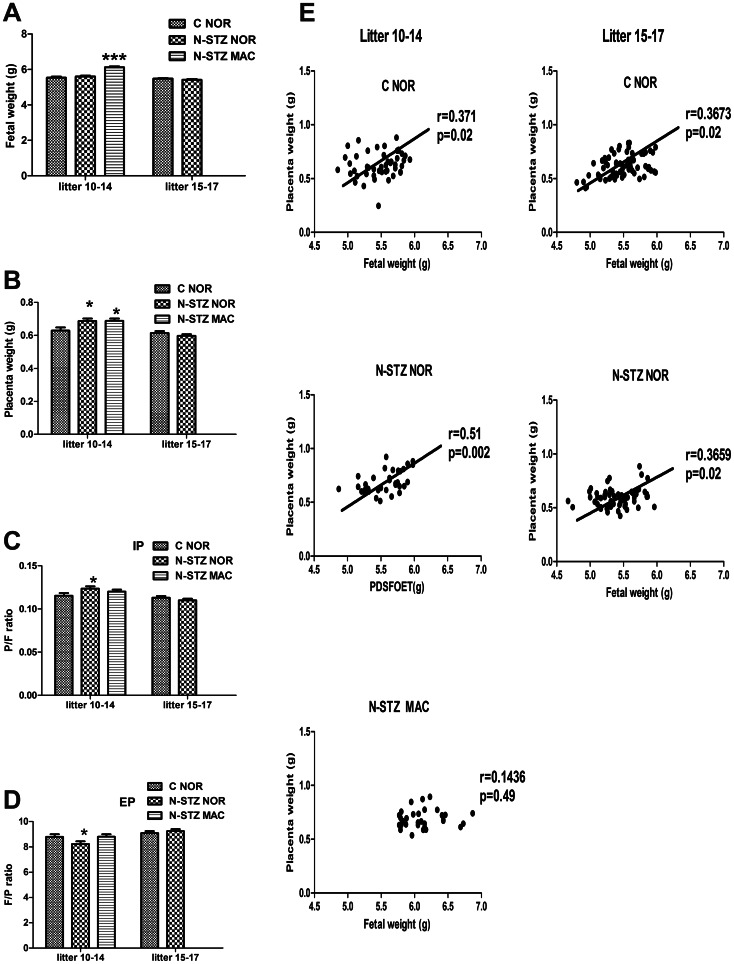
Figure 4. Fetal and placental growth in control and N-STZ pregnancies at GD21.
(A) Body weight of pups. (B) Placenta weight. (C) Placenta on fetus ratio (P/F). (D) Fetus on placenta ratio (F/P). (E) Correlation between placenta and fetal weight. C-NOR, control normosomic; N-STZ NOR, nicotinamide-streptozotocin normosomic; N-STZ MAC, nicotinamide-streptozotocin macrosomic. n = 4–6 litters per group. The effect of treatment was analyzed by one-way ANOVA followed by the Bonferroni posthoc test. Values represent mean ± SD. * p<0.05 indicates the significant difference between controls and N-STZ. The coefficient of correlation was calculated by Spearman test.

