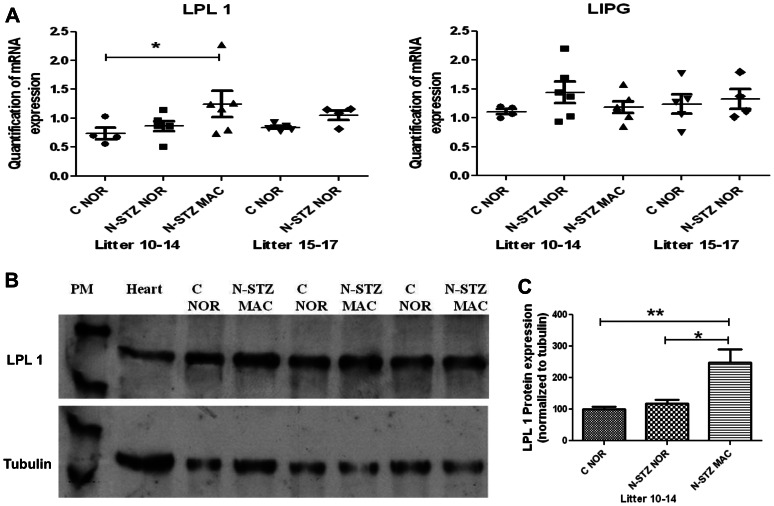
Figure 8. Lipoprotein lipase expression in the control and N-STZ placentas at GD21.
(A) Normalized real-time PCR transcripts of LPL1 and LIPG genes. Each symbol represents the mean of placental gene expression from pups within a single litter (n = 4–6 litters per group). Solid line indicates median values for all of the litters. (B) Representative western blots and (C) densitometry values for LPL1 protein expression in control and N-STZ placentas. Representative blots show expression within three paired litters (n = 4–6 litters). Rat heart was used as a positive control. The effects of treatment and litter size were analyzed by one-way ANOVA followed by the Bonferroni posthoc test. Values represent mean ± SD. Horizontal lines indicates the comparison between the two groups. * p<0.05 and **p<0.01 show the significant differences between groups. C-NOR, control normosomic; N-STZ NOR, nicotinamide-streptozotocin.normosomic; N-STZ MAC, nicotinamide-streptozotocin macrosomic.

