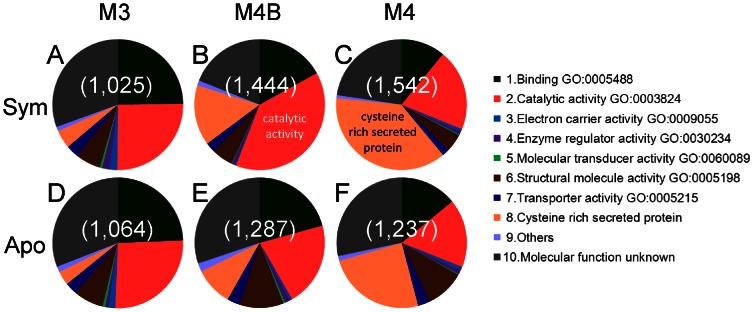
Figure 2. Gene Ontology (GO) molecular function terms assigned to the midgut EST data of R. pedestris.
Ratio of number of EST clones representing each GO term per total number of EST clones is shown as each pie graph division. (A–C) Symbiotic insect. (D–F) Aposymbiotic insect. Number of total EST clones is indicated in parentheses. Because one cluster can be associated with more than one GO term, total number of EST clones shown in parentheses may be different from those shown in Table 1. Abbreviations: Sym, symbiotic insect; Apo, aposymbiotic insect; M3, midgut third region; M4: midgut fourth region with crypts; M4B, anterior bulb of midgut fourth section.

