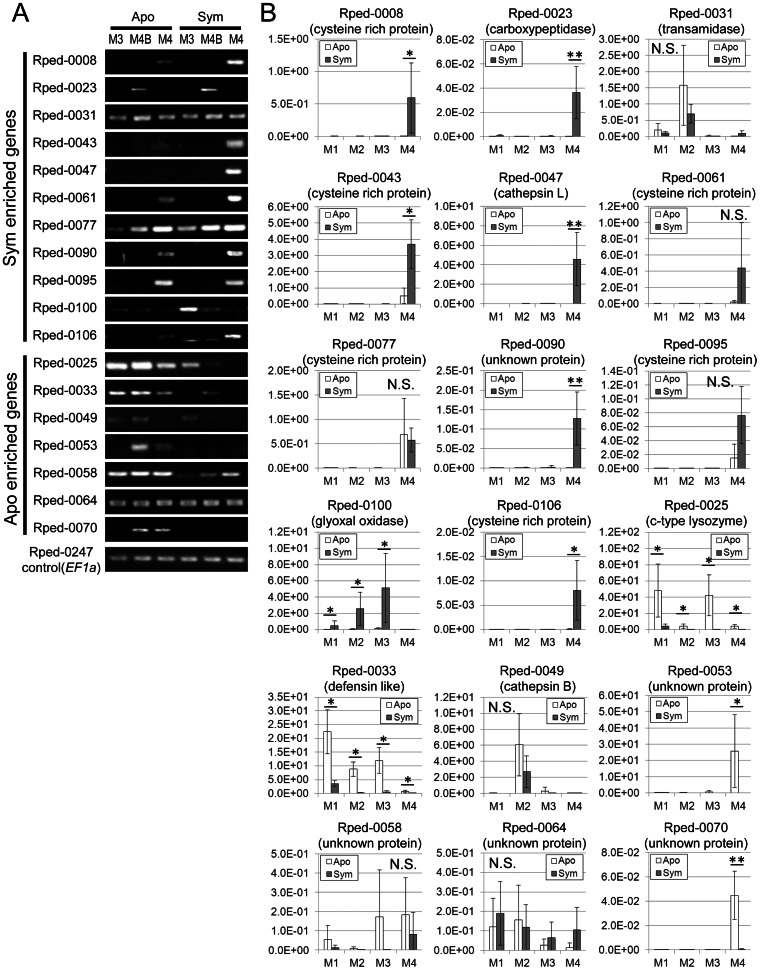
Figure 3. Relative expression levels of symbiosis- and aposymbiosis-associated gene candidates in R. pedestris.
(A) Semi-quantitative RT-PCR of candidate genes. Abbreviations are the same as in Figure 2. Elongation factor 1 alpha (EF1a) gene (Rped-0247) was used as an internal control. (B) Relative expression levels of candidate genes in four midgut parts, namely M1, M2, M3, and M4 (plus M4B). The expression levels were evaluated by quantitative RT-PCR in terms of each gene cDNA copies per EF1α cDNA copy. Means and standard deviations (n = 8) are shown. Statistically significant differences between aposymbiotic and symbiotic insects in each midgut region are shown by asterisks (t test; *, P<0.05; **, P<0.001). N.S. indicates no significant difference.

