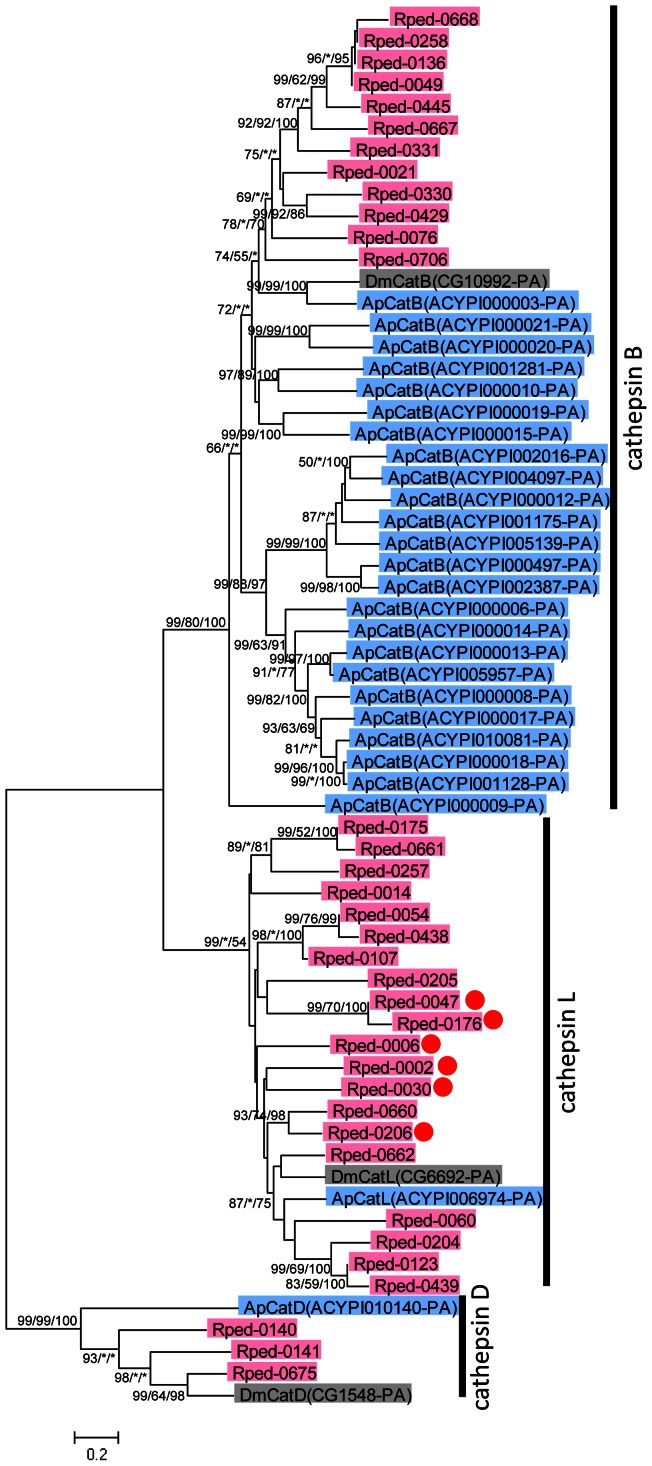
Figure 5. Diversity of cathepsin protease genes identified in the EST data of R. pedestris.
A neighbor-joining phylogeny inferred from 428 aligned amino acid sites is shown, while maximum likelihood and Bayesian phylogenies exhibited substantially the same topologies. On each node, statistical support values are indicated in the order of [bootstrap value of neighbor-joining]/[bootstrap value of maximum likelihood]/[posterior probability of Bayesian]. Asterisks indicate support values lower than 50%. Clades of cathesin B, cathepsin L and cathepsin D are indicated on the right side. Genes of R. pedestris, A. pisum and D. melanogaster are colored in red, blue and gray, respectively. Red circles indicate genes preferentially expressed in symbiotic insects (EST clones more than tenfold in symbiotic insect and no less than 5 EST clones).

