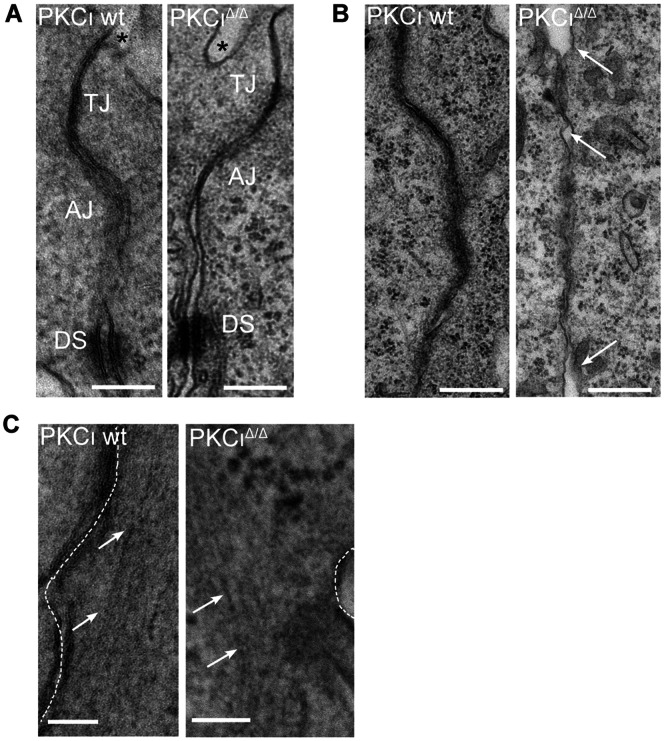
Figure 5. Electron microscopic analysis of PKCι deficient embryos.
Embryos were isolated at E7.5. (A) Apical junctional complex (AJC) formation in wt and PKCι deficient (PKCιΔ/Δ) embryos was compared. Functional complexes are indicated: tight junction (TJ), adherens junctions (AJs) and desmosomes (DSs). The amniotic cavity is indicated by an asterix. (B) Arrows indicate intracellular space in the apicobasal membrane in PKCι wt and PKCιΔ/Δ embryos. The orientation of the images is comparable to the images in A. (C) Arrows indicate the F-actin bundles parallel to the cell-membrane in wt and PKCιΔ/Δ embryos. EM analysis was performed as described in Materials and methods. Representative micrographs are presented. Bar is equivalent to 200 micrometer (200 µm).

