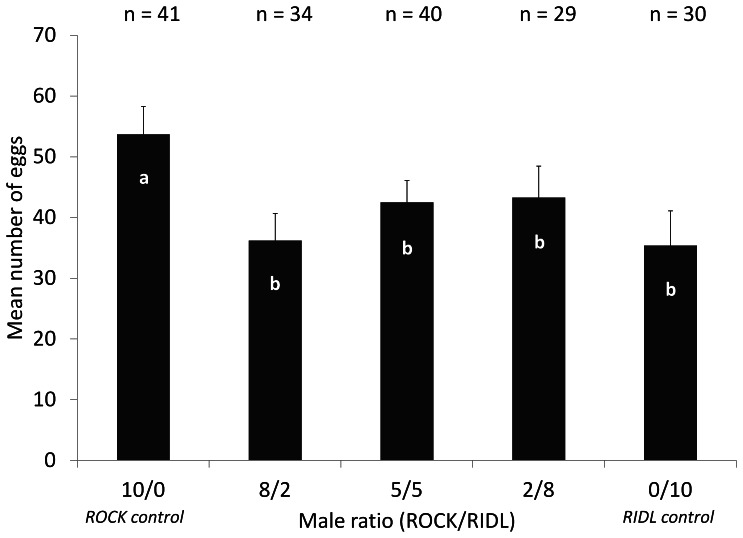
Figure 1. Egg production per female with different proportions of ROCK and RIDL males.
For each ratio of strains (ROCK/RIDL): mean number of eggs with Standard Errors (±SE). Above the figure, values (n) indicate the no. of females laying eggs. There is a significant difference in the mean number of eggs across the five ratio of strains, bars with different letters are significantly different (Generalized linear model: p = 0.00561).

