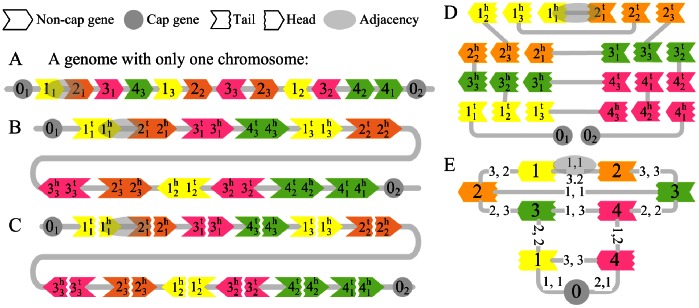
Figure 1. Representation of a genome, a PG and a CPG.
(A) A rearranged duplicated genome with duplicated size of 3 is represented as a sequence of signed integers, where a positive (negative) sign is represented by the direction of the colored arrow. (B) The same genome is represented as a sequence of extremities (i.e., heads, tails or cap genes). (C) PG of the above genome. Each non-cap gene is cut into head and tail, which becomes two vertices in the partial graph. (D) The vertex reposition of the PG in (C). (E) The contracted PG that is converted from the PG showed in (C) and (D). Each vertex corresponds to an extremity family. Numbers on each edge indicate the copy IDs (i.e., subscripts) of the two extremities connected by the corresponding adjacency. Note that the edge (1h, 2t) in (E) corresponds to 2 adjacencies (or edges) in (C), so its multiplicity is 2.

