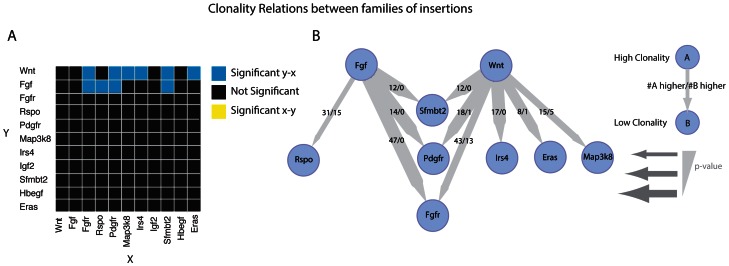
Figure 5. Analysis of clonality between different families of genes.
A. A heatmap of all combinations of gene families and single genes not assigned to a family. Significant difference in clonality for each family are calculated using a binominal test for all samples that are co-inserted in that specific gene (family) pair. Blue squares indicate a significant clonal relation from the group indicated on the Y-axis to the group indicated on the X-axis. Yellow squares indicate a significant clonal relationship from the X-axis to the Y-axis. Black squares indicate no significant relation. B. A network view of the heatmap in A. showing only significant (P<0.05) clonality relationships. An edge points from the more clonal gene(family) to the lesser clonal gene(family). The thickness of an edge is a measure of the significance of the clonality relation. For the fraction displayed on the edges, the numerator represents the number of times the parent node had a higher clonality score while the denominator represents the number of times the child node had a higher clonality score, in a tumor that contained insertions in both nodes.

