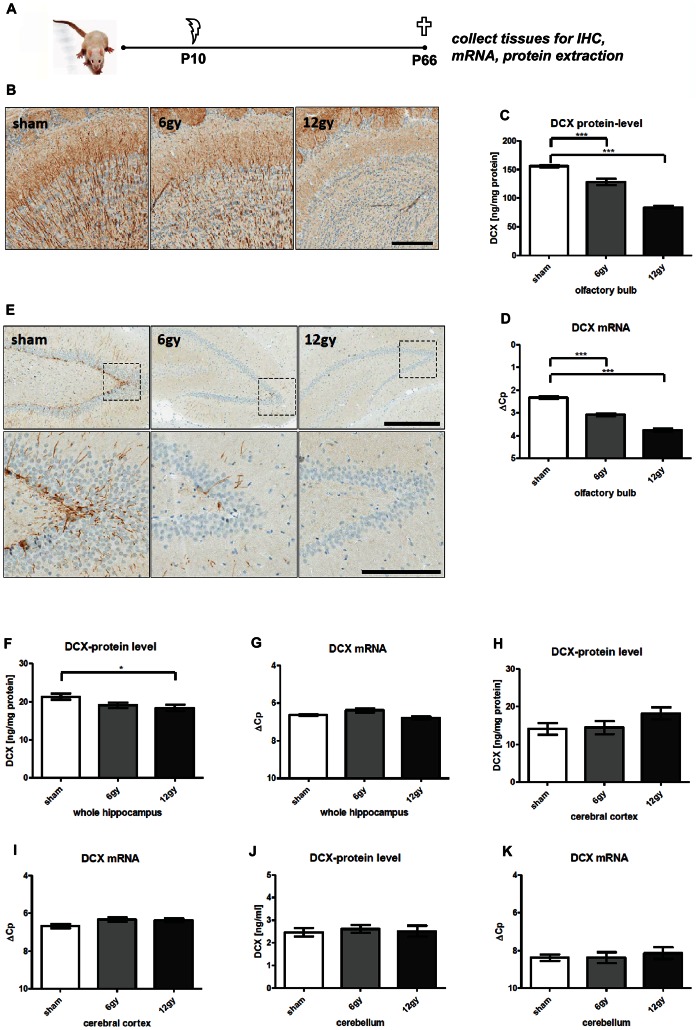
Figure 3. Irradiation-induced ablation of neurogenesis.
A, schematic diagram of experimental procedures. Female wistar rats received a high (12 gy) or low (6 gy) irradiation dose or were sham-treated at P10 (N = 10 per group). Mice were sacrificed 7 weeks after treatment. A subset of brains were processed for immunohistochemistry (12 gy: N = 2, 6 gy: N = 3, sham: N = 3). Residual brains were split into hemispheres and dissected for mRNA and protein analysis (N = 6/group). B, Representative images of Dcx-IR in the olfactory bulb of formalin-fixed paraffin embedded (FFPE) sections. Left-to-right: A high density of dendritic Dcx-IR is observed in the olfactory bulb granular layer sham-irradiated animals. Dendritic labeling is reduced with low-irradiation and virtually absent in animals after 12 gy-irradiation. Scale bar: 200 µm. C, bar graphs of Dcx-protein-levels in the olfactory bulb. A dose-dependent decrease in Dcx-protein levels is observed in irradiated animals vs sham-controls. D, bar graphs of Dcx-mRNA-levels in the olfactory bulb. A dose-dependent decrease in Dcx-mRNA levels is observed in irradiated animals vs sham-controls. E, Representative images Dcx-IR in the dentate gyrus of FFPE sections. Upper panel: overview of Dcx-IR in the dentate gyrus. Left-to-right: Dcx-IR is restricted to cells in the dentate gyrus SGZ with dendrites spanning into the granular and molecular layer. Lower panel: higher magnification of the SGZ. F, bar graphs of Dcx-protein-levels in the hippocampus. A slight dose-dependent decrease in DCX-protein levels is observed in irradiated animals. G, bar graphs of Dcx-mRNA-levels in the hippocampus. DCX-mRNA levels do not change significantly between sham and irradiated groups. H, bar graphs of Dcx-protein-levels in the cerebral cortex. I, bar graphs Dcx-mRNA-levels in cerebral cortex. DCX-mRNA levels do not change significantly between sham and irradiated groups. J, bar graphs of Dcx-protein-levels in the cerebellum. K, bar graphs of Dcx-mRNA-levels in cerebellum. Dcx-mRNA levels do not change significantly between sham and irradiated groups. Dunnett’s Multiple Comparisons Test.

