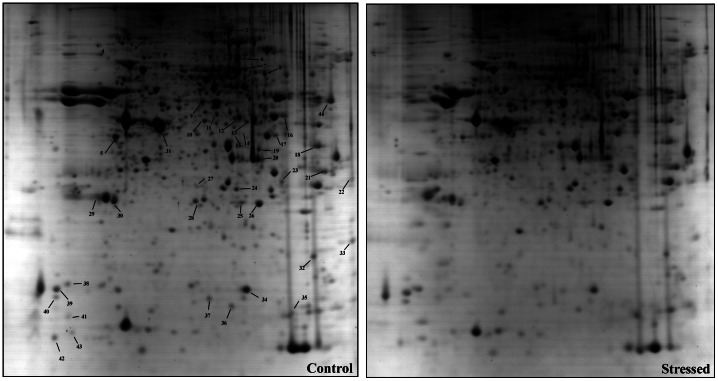
Figure 3. Two-dimensional gel electrophoresis of zebrafish brain shows differential protein levels in response to CUS.
Two-dimensional gel electrophoresis pattern of zebrafish brain (a, control and b, stress group) visualized with fast Coomassie staining. Proteins were separated according to the pI gradient (x-axis) in the first dimension and the molecular weight in the second dimension (y-axis). Eighteen spots (labeled in control gel) were identified as differentially regulated under CUS and analyzed by tandem mass spectrometry (MS/MS).

