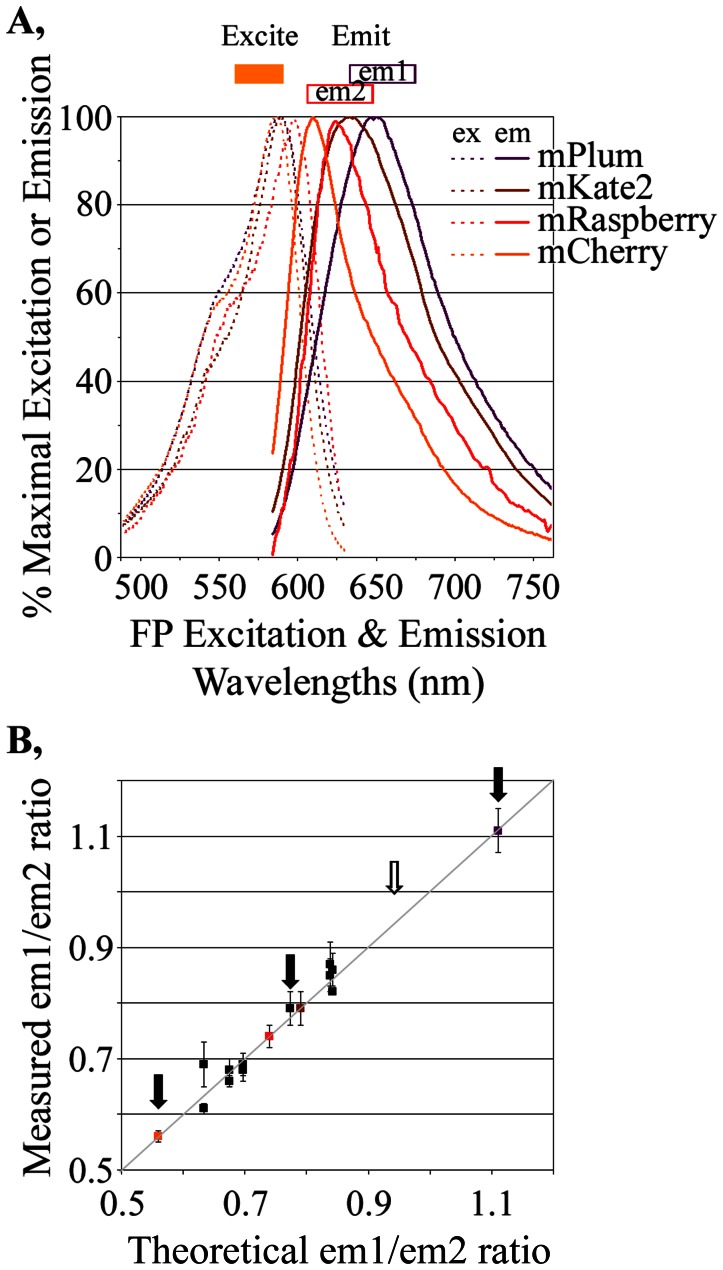
Figure 4. Cellular “bar-coding”.
A, Excitation and emission properties of four FPs used to create the bar-code. All FPs were excited by light of 560–590 nm (orange box) but emitted different relative amounts in two emission channels (em1: 635–675 nm; em2: 608–648 nm). For example, the area under the curve collected for mPlum in em1 would be slightly more than that in em2 whereas, for mCherry, em2 emissions would be much higher than em1 emissions. These differences were seen in practice (Table 3). B, The measured em1/em2 ratios for sixteen FPNLSFP markers using all possible combinations of the four FPs (Table 4) were similar to those predicted if one assumes no FRET amongst the FPs. The theoretical em1/em2 ratios were calculated from their relative abilities to be excited by 560–590 nm light (Fig. 4A), their relative brightness once excited (Table 3) and the em1 and em2 emissions detected by our instrument for the four homogeneous FPNLSFPs (mPlumNLSmPlum, mCherryNLSmCherry etc).

