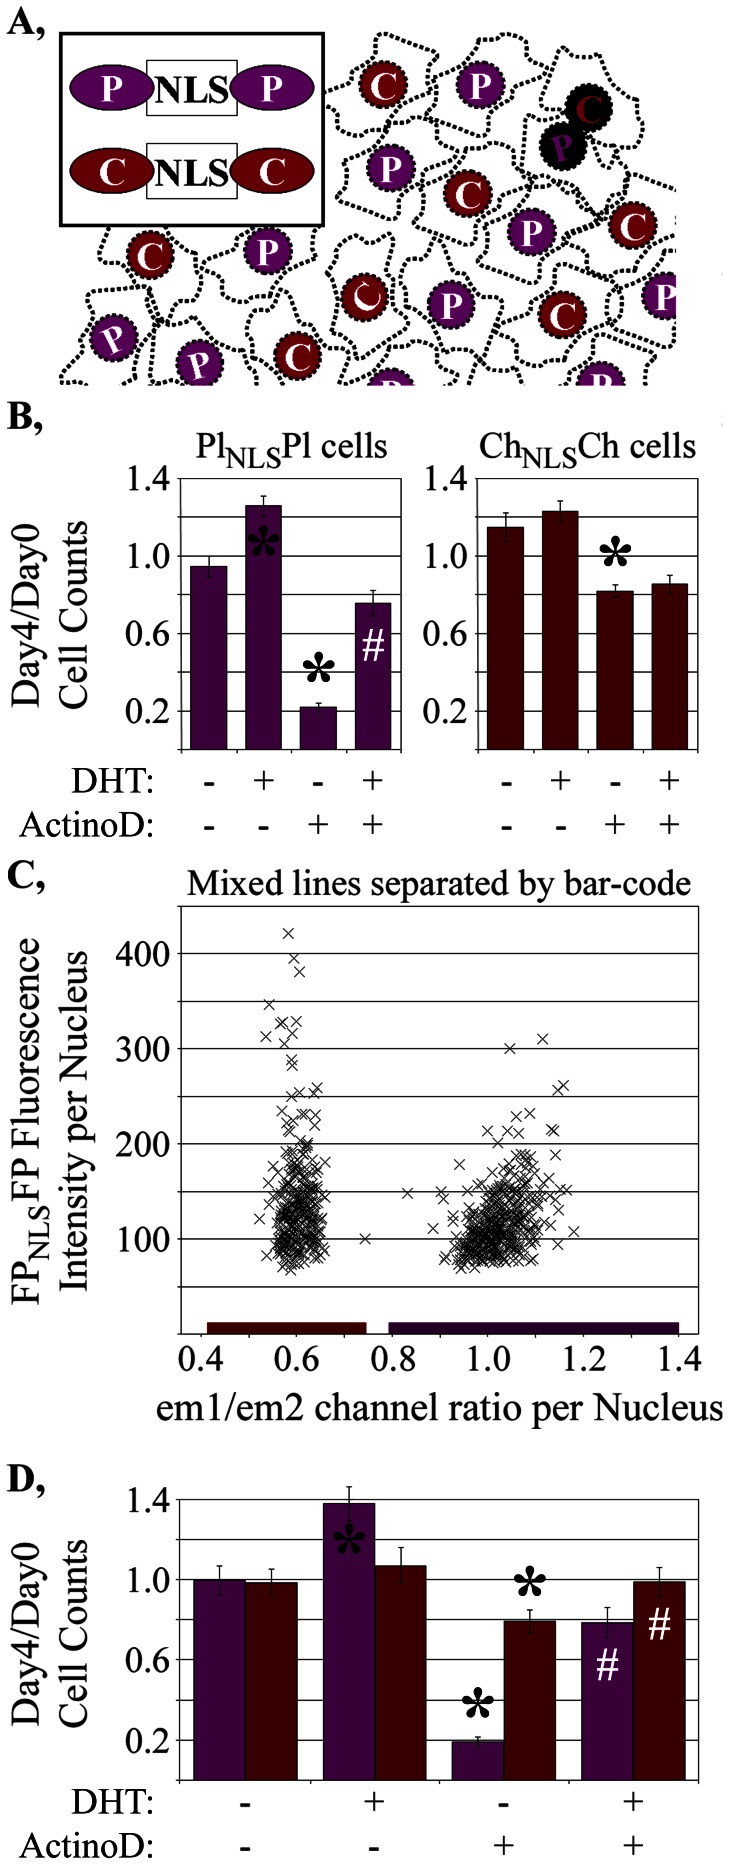
Figure 5. Application of bar-code to cell counting studies.
A, Concept of bar-code for mixing differentially marked FPNLSFP expressing cells. B, Differential response of two LNCaP-C4-2 cell subclones to an inhibitor of cell growth (actinomycin D). C, em1/em2 ratios of all cells within a representative well (x-axis) compared to the intensities of each cell in the em1 channel. D, LNCaP-C4-2 cells mixed, co-plated, treated exactly as in figure 5B then separated according to the bar-code showed similar treatment responses to the individually plated cells. Growth measurements are shown as the mean +/− sd from 8 (Fig. 5B) or 16 (Fig. 5D) wells for each treatment condition. *, statistically significant (p<0.01) increases or decrease in cell number relative to vehicle-treated cells; #, statistically significant (p<0.01) increase in cell number of DHT/actinomycin D treated wells relative to actinomycin D-treated wells.

