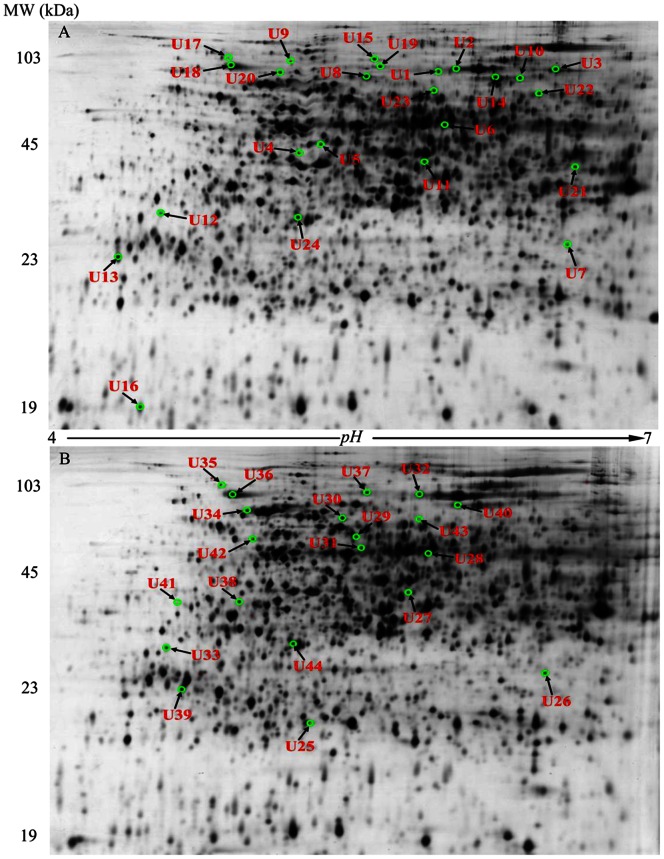
Figure 2. Representative 2-DE maps of root proteins in XZ16 exposed to Al for 24 h.
The proteins were isolated from the root of XZ16 exposed to 50 µM (A, upper) and 200 µM (B, below) Al for 24 h. Total proteins were extracted and separated by 2-DE. In IEF, 100 µg proteins were loaded onto pH 4–7 IPG strips (24 cm, linear). SDS-PAGE was performed with 12.5% gels. The spots were visualized by silver staining. Differentially accumulated protein spots are indicated by green sashes. Arrows indicate the differentially expressed protein spots whose expressions were significantly induced (fold changes ≥1.5) or unchanged (−1.50< folds <1.5) in XZ16 but down-regulated (folds <−1.50) in XZ61; or up-regulated in XZ16 but unchanged in XZ61, under 50 µM Al (U1–U24) and 200 µM Al (U25–U44) stress.

