
Figure 2. Return of mood to baseline after activating and inhibiting events.
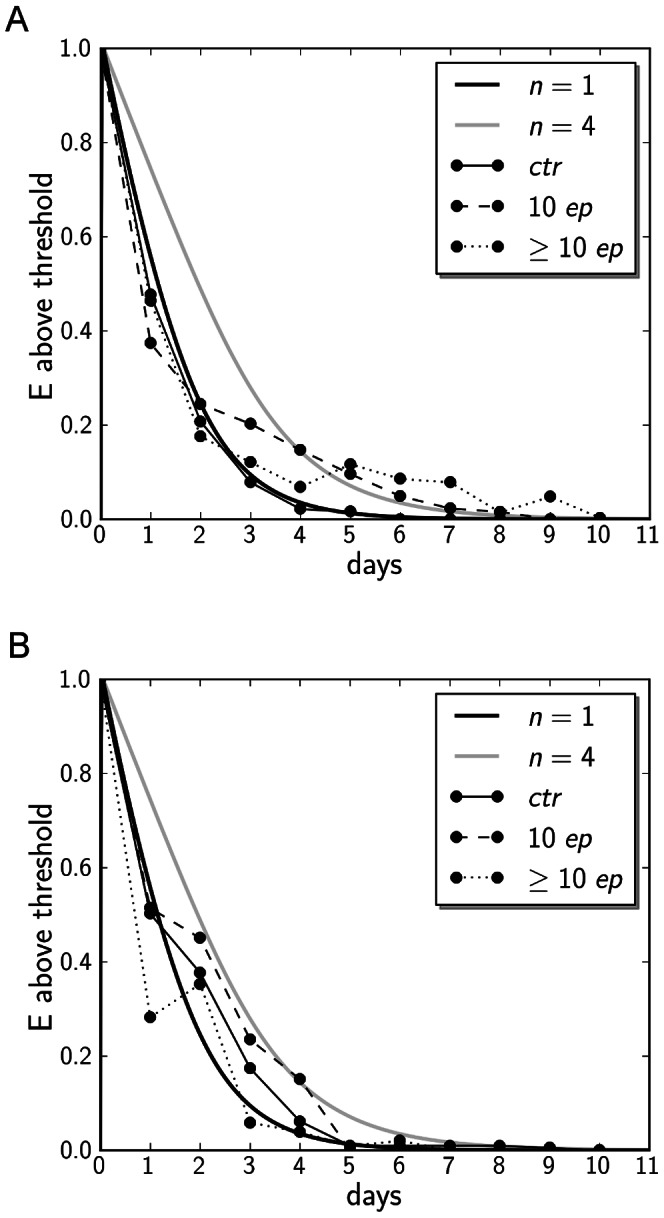
A: return to baseline levels after activating events. B: return to baseline levels after inhibiting events. Empirical data (thick black lines) are compared to simulation data (coloured lines). BES (Behavioural Engagement Scale) levels are normalized to maximum value after disturbance of reward and frustration. Zero on the y axis corresponds to the baseline BES level. Solid black line: Control group (N = 18 for reward, N = 51 for frustration plot) Dashed black line: Patients with less than 10 previous episodes. (N = 8 for reward, N = 26 for frustration plot) Dotted black line: Patients with 10 previous episodes or more. (N = 7 for reward, N = 14 for frustration plot). For the simulation data: Black and gray lines correspond to  and
and  , respectively. N represents the sample size.