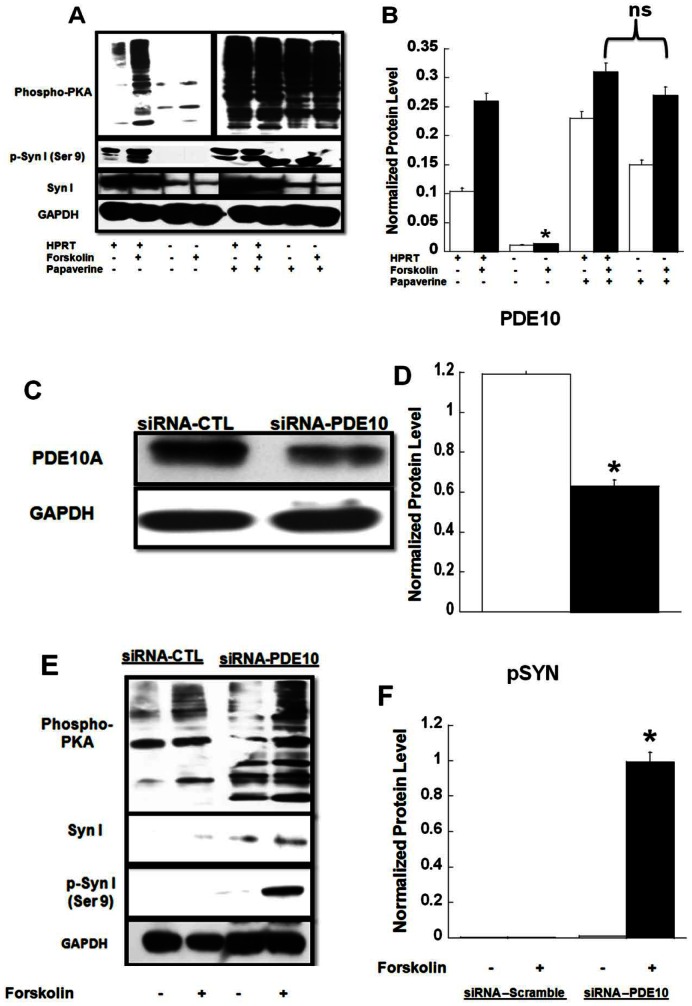
Figure 5. PDE10 inhibition restores PKA-mediated expression.
(A & B), immuno-blot and quantification analysis of p-Syn (Ser9), data show that the lower expression of phospho-PKA substrate and p-Syn (Ser9) in response to forskolin treatment in HPRT-deficient MN9D cells is restored in the presence of Papaverine (200 µM). Error bars represent mean ± SEM of duplicate measurements of two independent experiments (n = 4). The asterisks (*) represent statistical significance between forskolin treated cells without papaverine treatment (p<0.05, t-test). (C & D), immuno-blot and quantification analysis of PDE10A expression after transfection of HPRT-deficient MN9D cells with siRNA directed to the mouse PDE10 gene. The data show lower expression PDE10A protein in cells transfected with siRNA-PDE10A relative to cells transfected with scramble control siRNA (siRNA-CTL). Error bars represent mean ± SEM of duplicate measurements carried out independently twice (n = 4). The asterisks (*) represent the statistical significant (p<0.05, t-test) between the control (open bar, siRNA-CTL) and siRNA-PDE10A transfected cells (closed bar). This significant reduction of PDE10A protein contributes to the enhanced expression of phospho-PKA-substrates including p-Syn observed in (E & F). Error bars represent mean ± SEM of duplicate measurements of two independent experiments (n = 4). The asterisk (*) represents the statistical significant (p<0.05, t-test) between the siRNA-CTL and siRNA-PDE10A HPRT-deficient transfected MND9 cells treated with forskolin.

