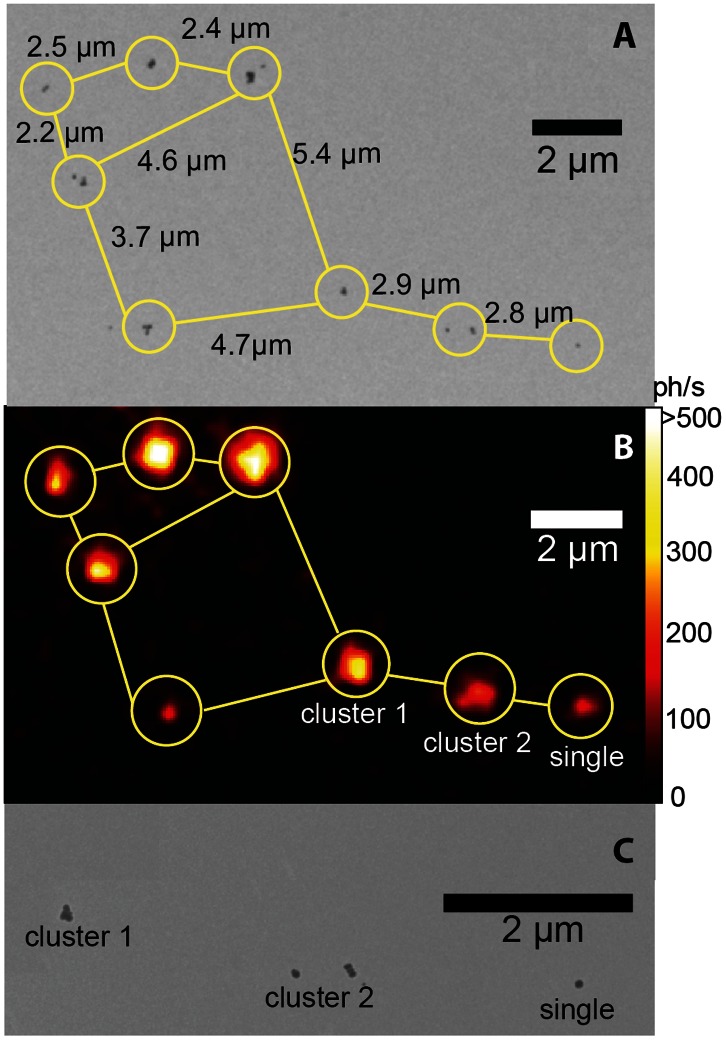
Figure 3. Single-UCNP correlative imaging.
(A) TEM and (B) epi-luminescence microscopy images corresponding to the same areas of the sample TEM grid. The distances between the individual (encircled) nanoparticles/clusters, given in (A), were precisely matched to those in (B) to identify the same UCNP constellation. (C) Close-up TEM image of the same area as in (A), where UCNP sites designated ‘cluster 1’, ‘cluster 2’, and ‘single’ correspond to the three sites in (B). The individual UCNPs within ‘cluster 1’ and ‘cluster 2’ were optically unresolvable. “Single” designates a single UCNP particle clearly observable, as a diffraction-limited spot in (B). The excitation wavelength, intensity and exposure time were 978 nm, ∼250 W/cm2 and 0.7 s, respectively. The pixel values were converted to photons/second (ph/s) and color-coded according to the look-up color bar in (B).

