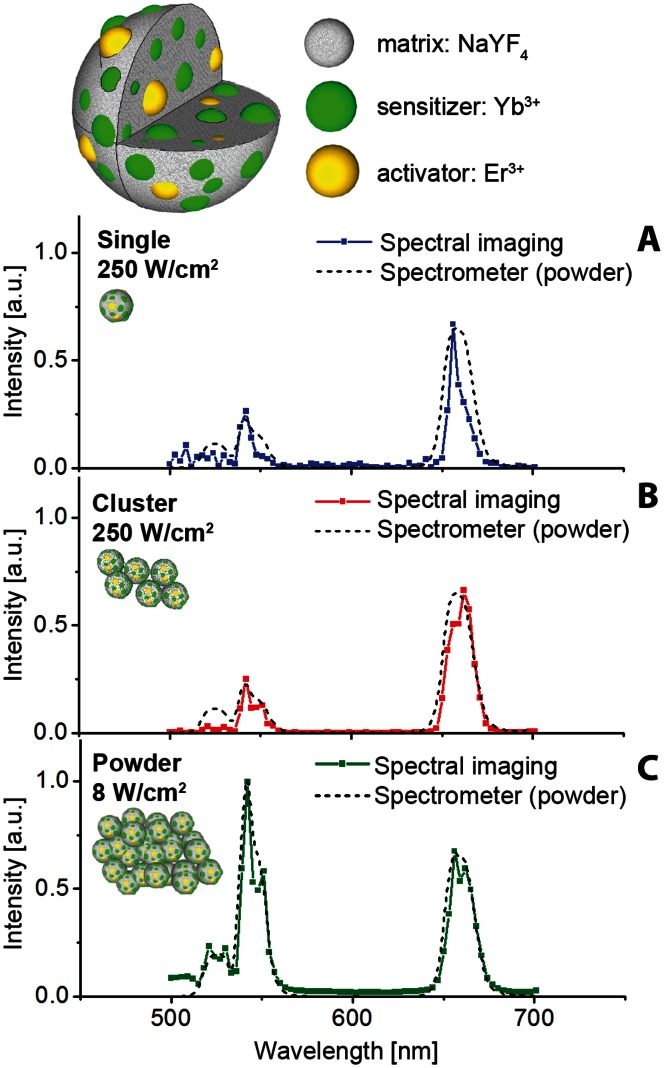
Figure 4. Spectral imaging of UCNPs.
Emission spectra of UCNPs in (A) single, (B) small cluster (designated ‘cluster 2’ in Figure 2) and (C) powder form (data points joined by solid lines) captured using hyperspectral epi-luminescence microscopy, overlaid with the ensemble-averaged spectra of UCNP powder captured by a calibrated spectrometer (dashed lines). The corresponding exposure times and EMCCD camera electron-multiplication (EM) gains were (A) 4 sec and 255; (B) 1.5 sec and 44; and (C) 0.014 sec and 9. Since the samples (A) and (B) contained considerably less emitters than the powder sample (C), the excitation intensities at λex = 978 nm were varied, respectively, from 250 W/cm2 to 8 W/cm2 to accommodate for the large disparity in the emission signals that would otherwise exceed the dynamic range of the EMCCD. The decreased Iex resulted in an increased green-to-red emission ratio in (C) due to the varied upconversion energy redistribution between the green and red multiplets. Top panel, schematic diagram of NaYF4:Yb,Er UCNP.

