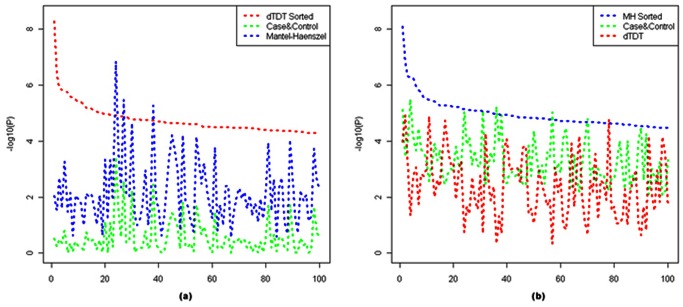
Figure 8. Line chart of top 100 signals from Case-Control, dTDT and MH tests.
(a) line chart ranked by -log10 (p-value) from dTDT and its corresponding -log10 (p-value) from the other two tests: Case-Control & MH test; (b) line chart ranked by -log10 (p-value) from MH test and its corresponding -log10 (p-value) from the other two tests: Case-Control and dTDT.

