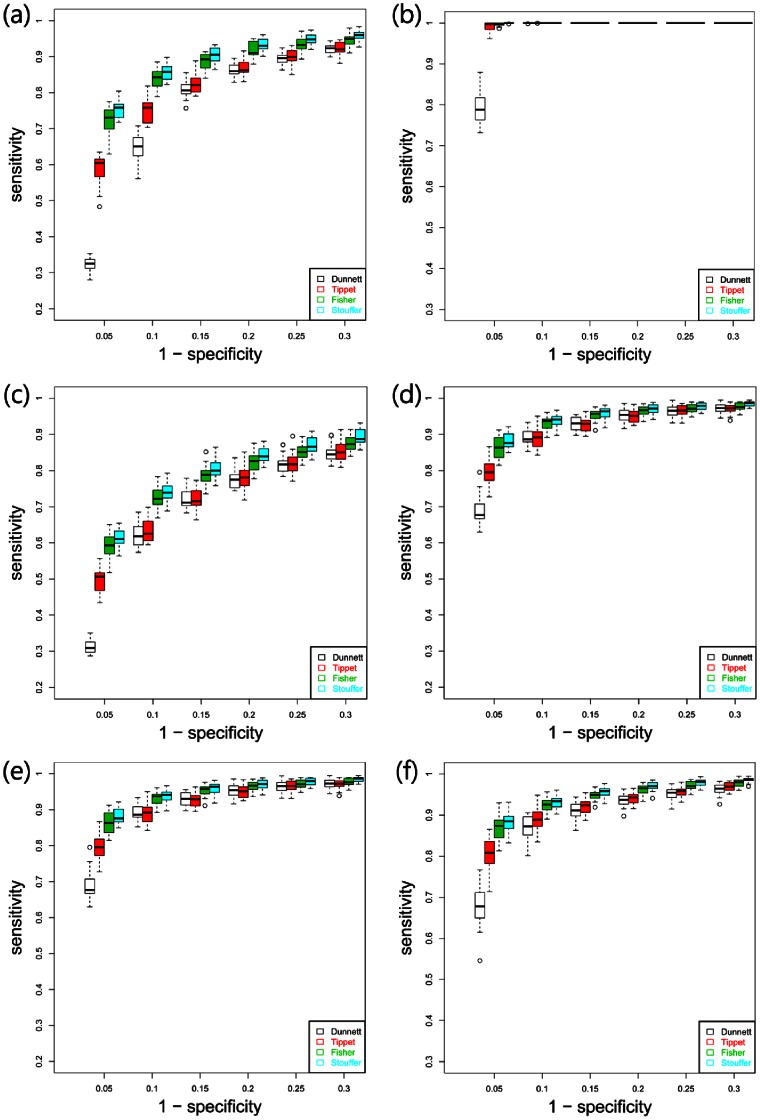
Figure 3. Boxplot of ROC curves for (A1) and (A2).
(a, b) are for the standard normal distribution; (c, d) are for the t-distribution with degrees of freedom 5; and (e, f) are for the gamma distribution with parameters 3 and 1. Here, the number of samples in (a), (c), (e) are 5, and the number of samples in (b), (d), (f) are 20.

