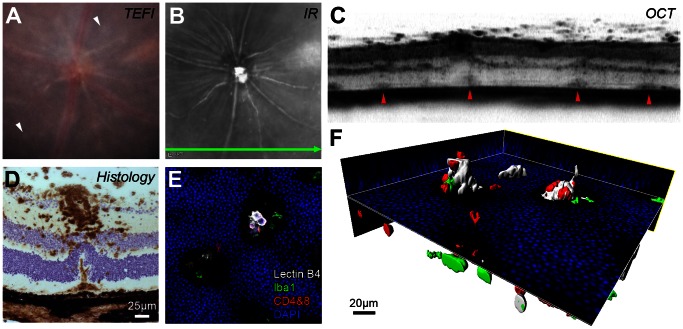
Figure 2. Abnormal OCT signals in vivo correspond to structural changes and associated cellular infiltrates.
Images from an eye 80 days post-induction of EAU (A–C) can be interpreted using matched ex vivo histology (D–F). On TEFI (A) multiple pale retinal lesions (white arrowheads) are present. The infrared (IR) image (B) marks the position and orientation of the simultaneously obtained OCT scan (C). Focal changes at the level of the subretinal space/deep retina correspond to the observed lesions (red arrowheads). (D) Note the CD45+ cellular infiltrate (DAB in brown with haematoxylin counterstain) around the superficial vessel and under the displaced outer nuclear layer. A limited projection image (E) and 3D reconstruction (F) of the stained retinal flat-mount identifies these lesions as folds in the outer nuclear layer containing T cell - CD4+ & CD8+ (red), myeloid - lectin B4 binding (white) and Iba1+ (green) cell populations protruding from the subretinal space (DAPI in blue). Movie S1 shows an animated version of this panel.

