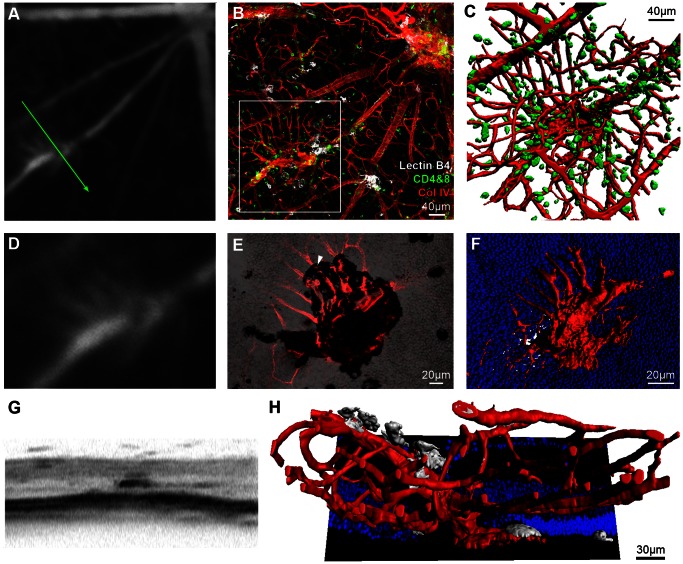
Figure 4. OCT imaging can guide identification and characterisation of novel features within the EAU model.
Fundus fluorescein angiography (FFA) on an eye 36 days post-induction of EAU revealed an abnormality initially thought to lie within the pre-defined spectrum of vasculitis (A). Retinal flat-mount revealed an atypical vascular lesion arising along the course of a large vessel (B). 3D reconstruction of the region enclosed by the white box, with CD4+ & CD8+ cells (green) displayed (C). Magnified view of the FFA (D) correlates with a combined collagen IV (red) and brightfield projection image viewed from the subretinal space towards the vitreous (E). Note the black patch corresponding to RPE adherence during retinal separation. Vessels pass through this region (example indicated by white arrowhead) having arisen from the retina after penetrating the outer nuclear layer (nuclei in blue) - highlighted in the reconstruction (F). OCT demonstrates a unique, dense signal appearance (G), inconsistent with more widely observed vasculitic changes in EAU. The arrangement seen on sagittal reconstruction (H) might partly explain the appearance, which could be consistent with inflammatory induced intraretinal telangiectasia, vascular reorganisation or neovascular buds. Lectin B4 staining is displayed (white). The green arrow indicates the location and orientation of the OCT scan. See Movie S2 for an animated 3D reconstruction.

