Fig. 4.
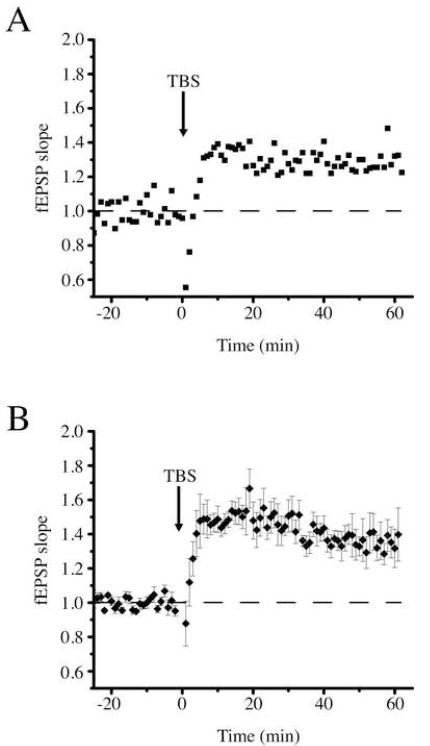
Measurement of long-term potentiation using a 16-channel recording electrode. (A) Single field excitatory potentials (fEPSPs) at each of the 16 recording sites before (left) and after (right) theta burst stimulation (TBS). The channel with the greatest rising slope (thick line) was used for fEPSP slope measurements. Scale bar: 1 mV, 20 ms. Approximate locations of recording sites are designated by letter code: HF hippocampal fissure; SLM stratum lacunosum-moleculare; SR stratum radiatum; SP stratum pyramidale; SO stratum oriens; ALV alveus. (B) Effect of TBS on fEPSP slope in the experiment illustrated in panel A. Responses were normalized to the mean response during the 20-minute baseline period. (C) Average effect of TBS on fEPSP slope in four different experiments. Error bars represent standard deviation.

