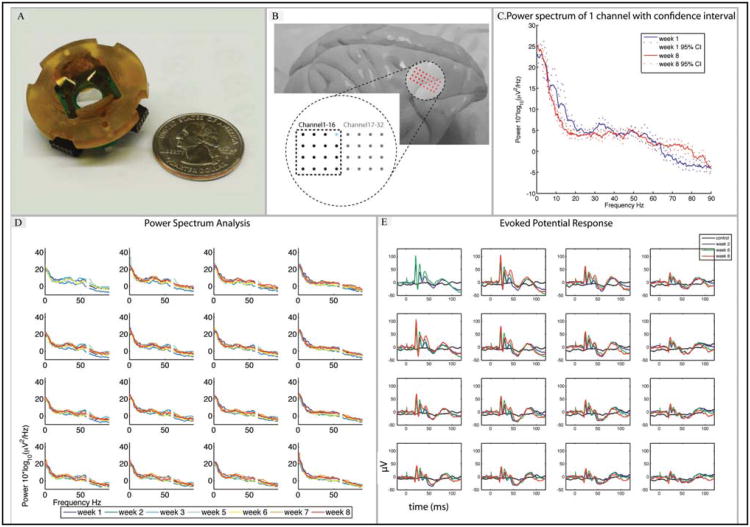
Figure 5.
Long-term micro-ECoG recording comparison. A) An electrode array and platform design that fits a 19 mm craniotomy in comparison with a quarter coin. B) Position of the electrode array on a non-human primate brain (Rhesus macaque), situated over sensorimotor cortex. C) Power spectrum (with 95% confidence intervals) of an example electrode site (highlighted in blue in (Figure 5B)) showing stability of the recorded baseline signal over an 8 week period. D) Power spectra of channels 1-16 over 8 weeks show long-term stability in long-term implant (60 Hz line noise omitted). E) Evoked potential response due to contralateral hind limb electrical stimulation (2.5 mA, 2 ms) compared to control (no stimulus) (week 2, 6 and 8).

