
Figure 6.
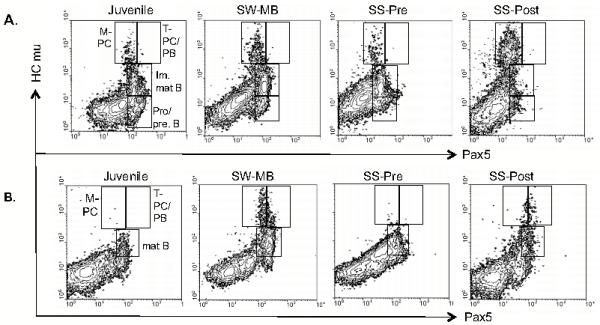
Contour graphs from flow cytometric analyses in fixed and permeabilized sockeye salmon immune tissues. Shown are representative contour graphs for each collection site and for each study group. N=4 for each group except for juveniles, for which N=7. Y-axis: anti-HCmu labeled with Alexa555. X-axis: anti-Pax5, paired domain-specific antibody labeled with Alexa647. A. Anterior kidney; M-PC: HCmu++/Pax5−; plasmablasts/T-PCs: HCmu++/Pax5+; Pro/pre-B: HCmu−/Pax5+; (im)mature B: HCmu+/Pax5+. B. Spleen, as A except mature B: HCmu+/Pax5+.