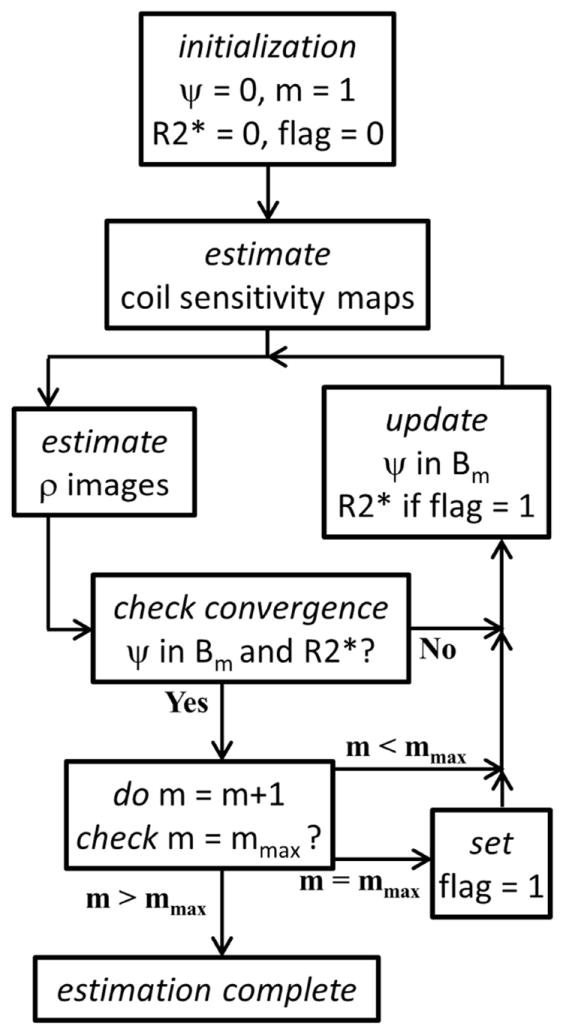
Figure 2.

A flowchart depicting the estimation algorithm. After estimating the coil sensitivity maps, the water and fat images (ρ) and the B0 field (ψ) and R2* maps are alternately estimated. The B0 field map is updated using cubic B-splines of successively finer scale, where m represents the scale and Bm is the corresponding B-spline set. The R2* map is estimated only upon reaching the finest scale mmax. Convergence is reached when both the B0 field and the R2* map update terms (Δψ and ΔR2*, respectively) have a maximum absolute value of less than 1Hz.
