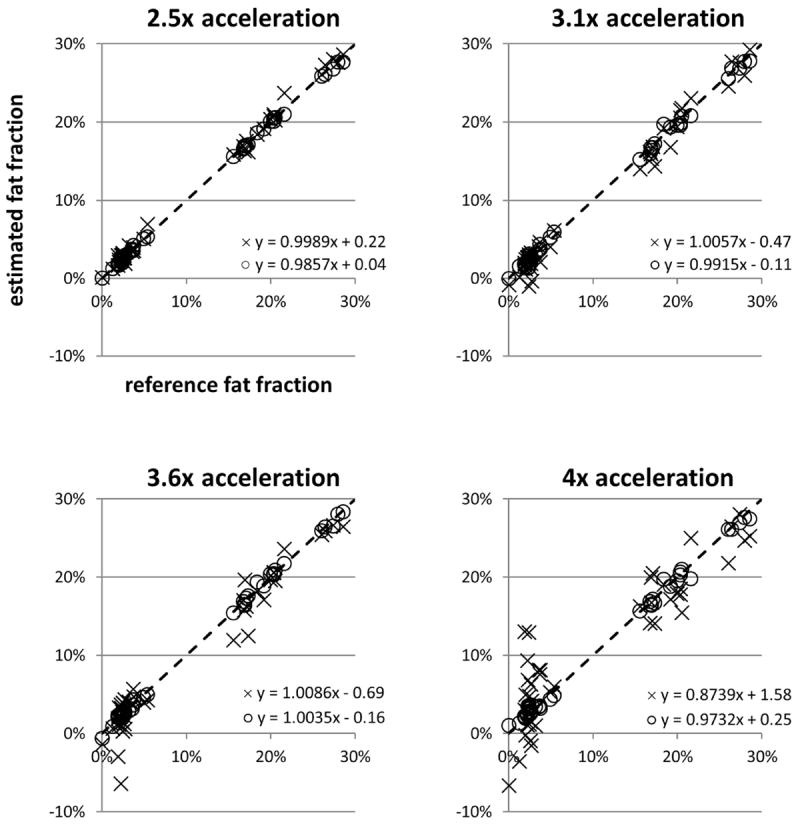
Figure 5.

Scatterplots and linear trendline equations of the estimated fat fraction versus reference fat fraction for ARC/T2*-IDEAL (×) and the proposed method (○) at each acceleration factor. Each point in the plot represents the estimates in one ROI. The identity line is denoted by dashes.
