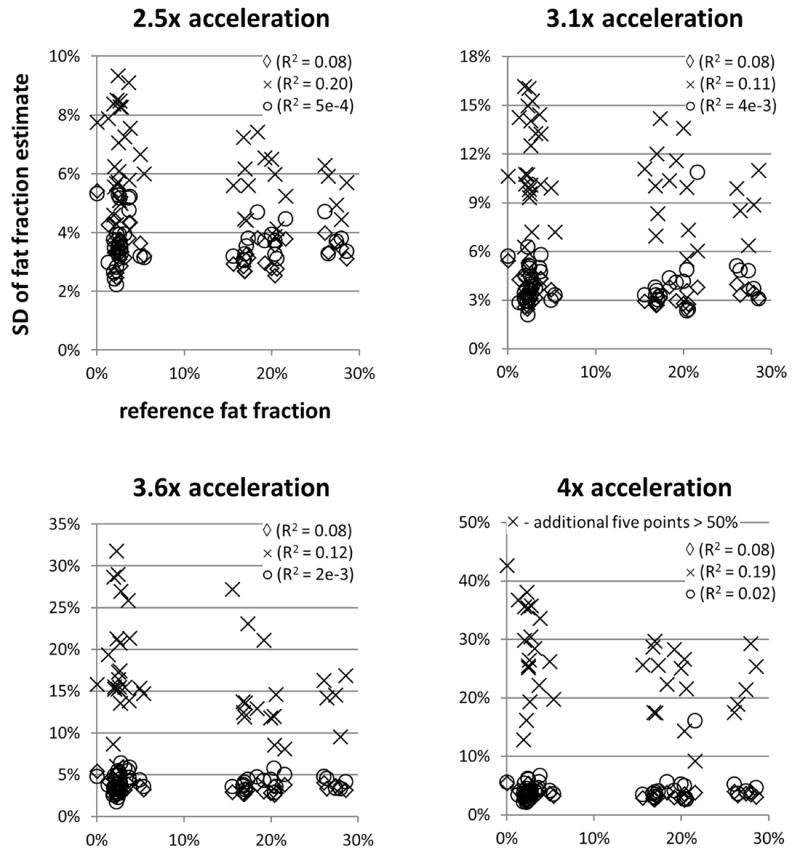
Figure 7.

Scatterplots showing the standard deviation (SD) of the fat fraction estimates in the ROI versus the reference fat fraction value for T2*-IDEAL (◊), ARC/T2*-IDEAL (×), and the proposed method (○). Note that the SD values for T2*-IDEAL (◊) are for 1x acceleration. At all acceleration factors, the average standard deviation for ARC/T2*-IDEAL was higher than that for the proposed method. For all three methods, the low R2 values indicate that the standard deviation of the fat fraction estimates does not exhibit a strong linear dependence on the reference fat fraction value.
