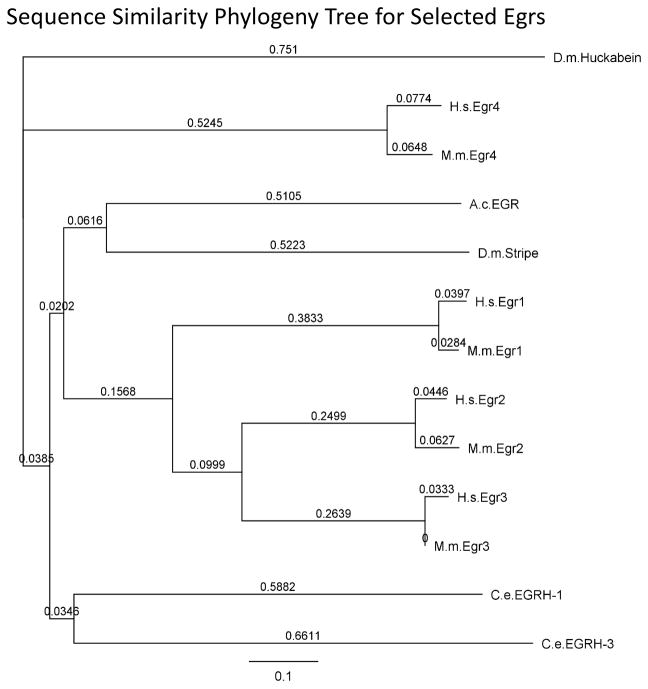
Figure 3.
Gene phylogeny tree based on predicted sequence similarity from Figure 2. The figure was constructed using the neighbor-joining method with a Jukes-Cantor model of genetic distance. The values on the tree represent genetic distance between nodes expressed in units of substitution per site.

