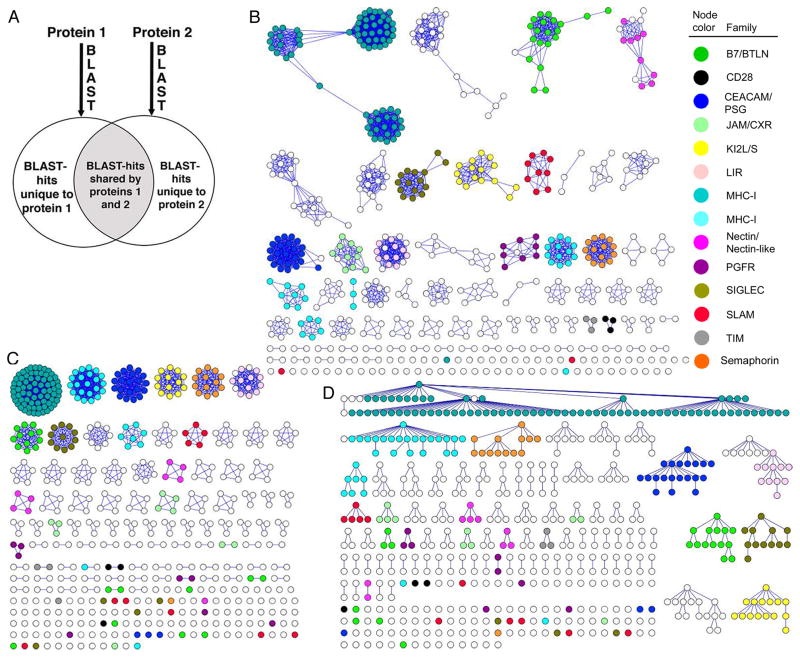
Figure 1.
A graphical presentation of functional families within the IgSF using three clustering strategies. Each member of the IgSF is represented by a circle. Members of 14 hand-curated families are represented with colored circles. A) Schematic representation of the Brotherhood method. The groups of evolutionarily related proteins are generated for each protein using Blast. Proteins are matched if their Blast-groups intersect (gray area) and do not differ (white area) above a certain threshold. B) Clusters generated using Brotherhood method, with an overlap threshold of 0.45. C) Clusters generated by SCI-PHY. D) Clusters generated by CD-HIT with a 30% sequence identity threshold.

