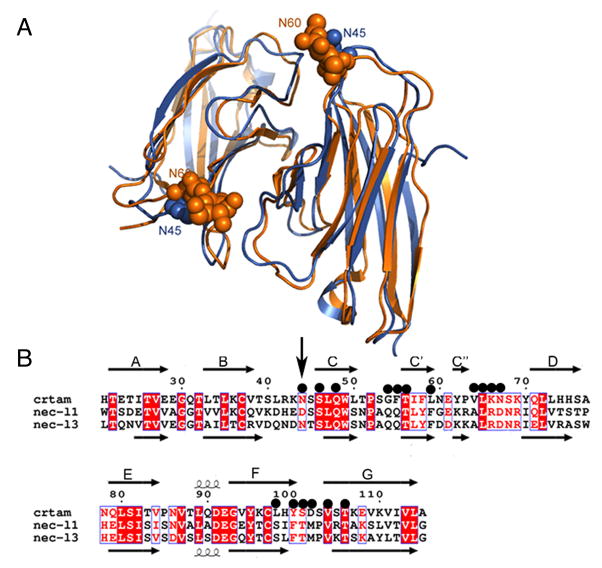
Figure 5.
Structural comparison of CRTAM and nectin-like proteins. A) The ribbon diagram of the structural superposition of CRTAM (in blue) with nec-l3 (in orange). N45 of CRTAM and the N-acetylglucosamine residues on N60 of nec-l3 are displayed as spheres. B) Structure-based alignment of CRTAM, necl-1 and nec-l3 sequences. Invariant and conserved alignment positions are highlighted in red background and red letters, respectively. The secondary structure corresponding to CRTAM and necl-3 are shown above and below the alignment, respectively, where arrows represent strands. Black circles mark residues forming the CRTAM Ig-V homodimer interface. The vertical black arrow marks the sequence positions of N45 and N60 of CRTAM and nec-l3 respectively.

