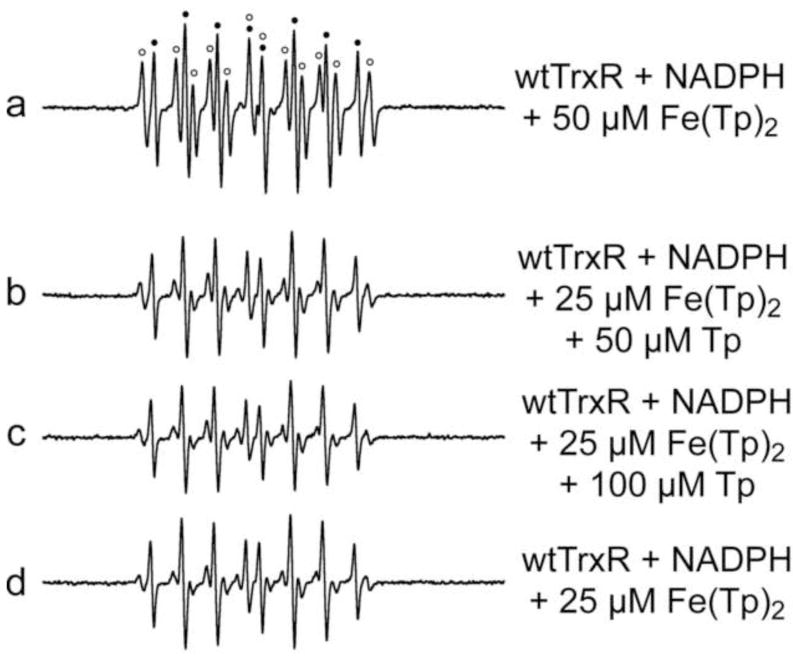
Fig. 3.
Representative ESR spectra comparing the potential effects of excess free Tp when incubated with wtTrxR and Fe(III)(Tp)2. Samples were incubated for 15 min at 37°C under room air, and contained 14 mM DEPMPO, 0.3 μM wtTrxR, 0.4 mM NADPH, and varied concentrations of Fe(III)(Tp)2 and Tp as indicated. For spectrum a, components of the signal corresponding to DEPMPO/HO• are indicated by black dots, whereas those corresponding to the carbon radical adduct of DEPMPO are indicated with open circles. See Fig. 1 for the ESR instrument settings.

