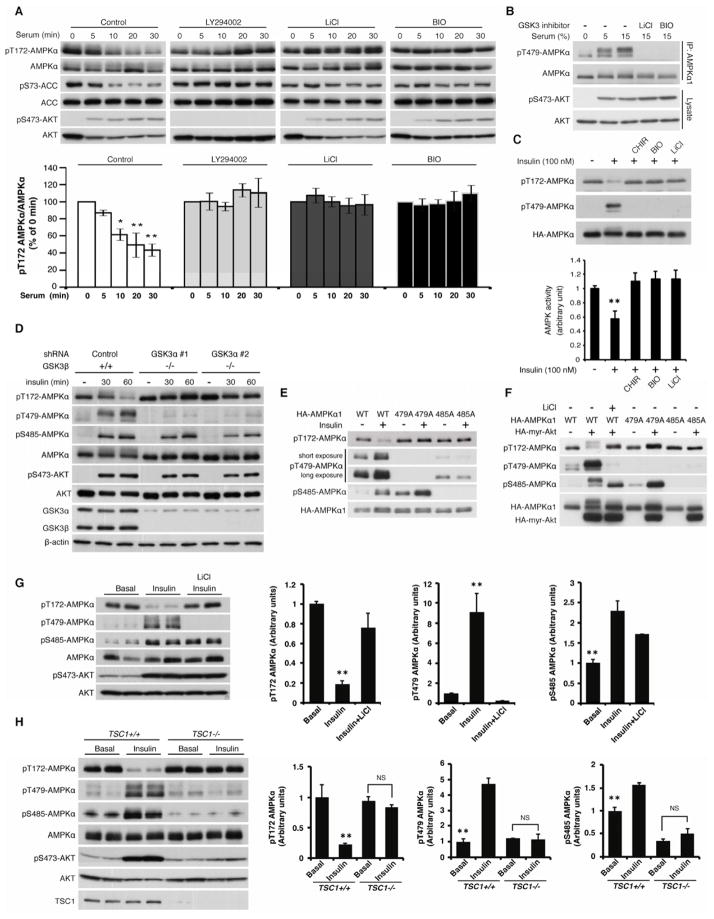
Figure 5. The PI3K-Akt pathway inhibits AMPK via GSK3-dependent Thr479 phosphorylation of the AMPK α subunit.
(A) Serum stimulation inhibits AL phosphorylation of the endogenous α subunit in a PI3K- and GSK3-dependent manner. Serum- and glucose-starved MEF cells were stimulated with 10% dialyzed serum for the indicated times in the presence or absence of PI3K inhibitor (LY294002: 20 μM; preincubation for 2 hrs) or GSK3 inhibitors (LiCl: 20 mM, BIO: 5 μM; preincubation for 2 hrs). Levels of AL phosphorylation of endogenous AMPK α subunit were quantified. *p<0.05, **p<0.01 vs time 0, mean±SEM (n=3).
(B) Serum stimulation induces GSK3-dependent Thr479 phosphorylation of the α subunit. MEF cells were treated with the indicated concentrations of serum for 30 min in the presence or absence of GSK3 inhibitors.
(C) Insulin enhances GSK3-dependent Thr479 AMPK phosphorylation. The effect of insulin (100 nM for 60 min) on Thr479 or AL phosphorylation, or the kinase activity of the α1 subunit was monitored in the presence or absence of the GSK3 inhibitors in serum-starved HEK293E cells. **p<0.01 vs other groups, mean±SEM (n=3).
(D) Ablation of GSK3 attenuates insulin-induced Thr479 phosphorylation and AL de-phosphorylation. GSK3α was knocked down in GSK3β−/− MEF cells. The effects of insulin (100 nM) on AL and Thr479 phosphorylation of the endogenous α subunit were monitored.
(E) Insulin-dependent Ser485 phosphorylation is required for GSK3-induced Thr479 phosphorylation. HEK293E cells were transfected with the indicated AMPK α1 subunits. The cells were treated with insulin (100 nM) for 60 min.
(F) Active Akt induces AL dephosphorylation through GSK3-dependent Thr479 phosphorylation in HEK293E cells.
(G) Insulin induces AL dephosphorylation in a GSK3-dependent manner in vivo. C57BL/6J male mice starved for 16 hours were treated with insulin (1 mU/g, ip) for 60 min. LiCl (200 μg/g, ip) was injected 2 hrs before obtaining heart tissues. **p<0.01 vs other groups, mean±SEM (n=5).
(H) PI3K activity is required for GSK3-dependent AMPK inhibition in vivo. Wild type and muscle-specific TSC1 knockout male mice were treated as Figure 5G. **p<0.01 vs other groups, NS indicates “not significant”, mean±SEM (n=3). See also Figures S5.

