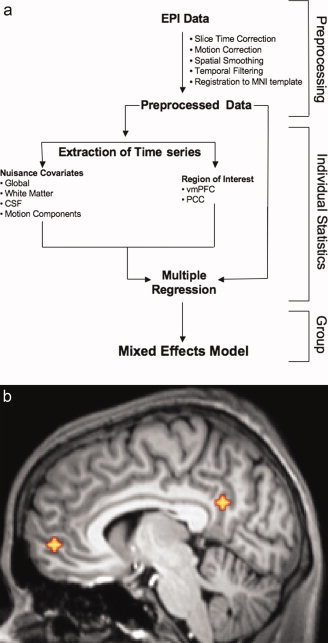
Figure 1.

(a) Diagram of data processing steps. (b) Locations of seeds used for correlation analysis (vmPFC Talairach coordinates = 2, 54, −3; PCC Talairach coordinates = −2, −51, 27). [Color figure can be viewed in the online issue, which is available at www.interscience.wiley.com.]
