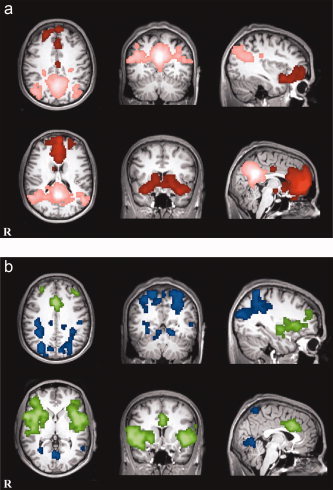
Figure 3.

Direct comparisons between positive and negative networks for each seed. (a) vmPFC (red) and PCC (pink) positively correlated networks. (b) vmPFC (blue) and PCC (green) negatively correlated networks. [Color figure can be viewed in the online issue, which is available at www.interscience.wiley.com.]
