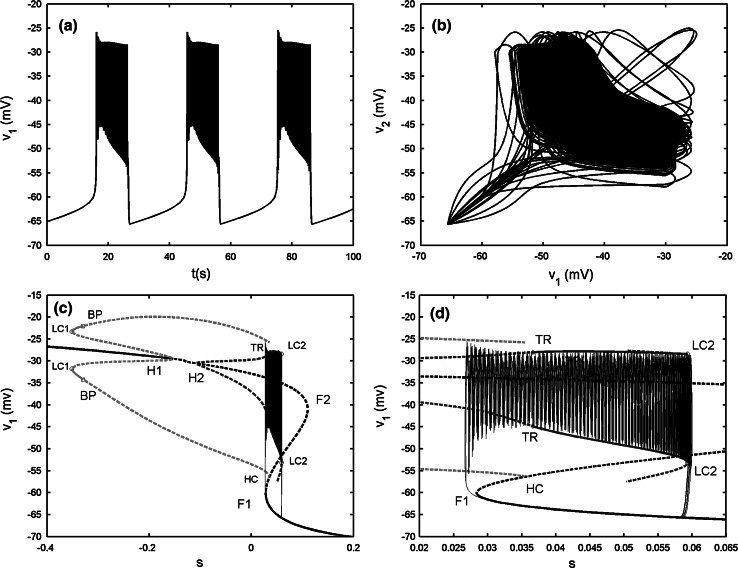
Fig. 10.
Two chemically coupled cells with gs = 2, gsyn = 0.13. a Time series of the variable v1. b The projection on (v1, v2) plane. c Fast–slow dynamics analysis of the chemically coupled system. The description of the lines and the points is the same as that in Fig. 9b. d The enlargement of the bistability region in c

