Fig. 13.
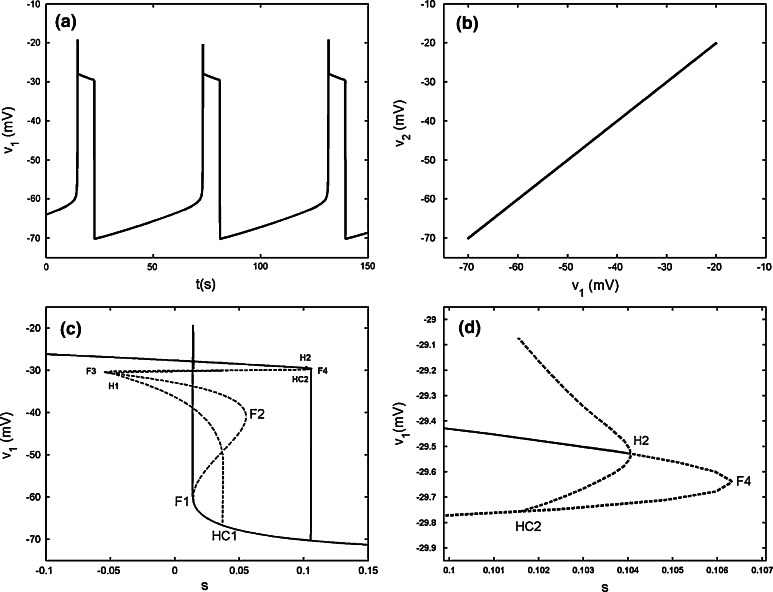
Two chemically coupled cells with gs = 4, gsyn = 2.4. a Time series of the variable v1. b The projection on (v1, v2) plane. c Fast–slow dynamics analysis of the chemically coupled system. The solid and dashed lines represent the stable and unstable states, respectively. F1–F4 are the fold bifurcations, respectively. H1 and H2 refer to the subHopf bifurcations. HC1 and HC2 refer to the homoclinic bifurcations. d The enlargement of the region near the point H2

