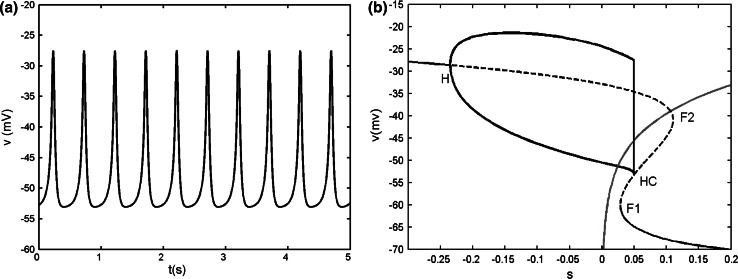
Fig. 14.
a Time series of the single model with gs = 2. b Bifurcation diagram of the fast subsystem of [Eqs. (8), (9)]. H refers to the supHopf bifurcation, F1 and F2 refer to the fold bifurcations, HC refers to the homoclinic bifurcation. The C shaped curve represents the maximum and minimum values of periodic solutions originated from H. The phase plot of the whole system is also superposed on the (v, s) plane. The red line is the s-nullcline. (Color figure online)

