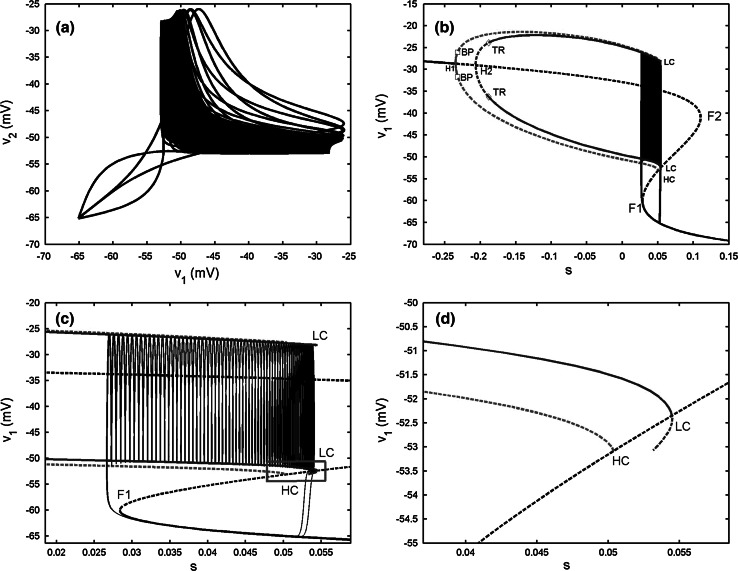
Fig. 3.
Two electrically coupled cells with gs = 2, gc = 0.01. a The projection of the coupled system on (v1, v2) plane. b Bifurcation diagram for the fast subsystem of two-cell model [Eqs. (1), (2)] with s = s1 = s2 taken as the bifurcation parameter. H1 and H2 refer to the supHopf bifurcations, BP refers to the pitchfork of periodic bifurcations labeled by open squares, TR refers the torus bifurcation labeled by diamonds, F1 and F2 refer to the fold bifurcations, HC refers to the homoclinic bifurcation, LC refers to the fold limit cycle bifurcation. The red and blue lines represent IP and AP branches, respectively. c The enlargement of the bistability region in b. The phase plot of the whole system is also included. d The magnification of the rectangular area in c. (Color figure online)

