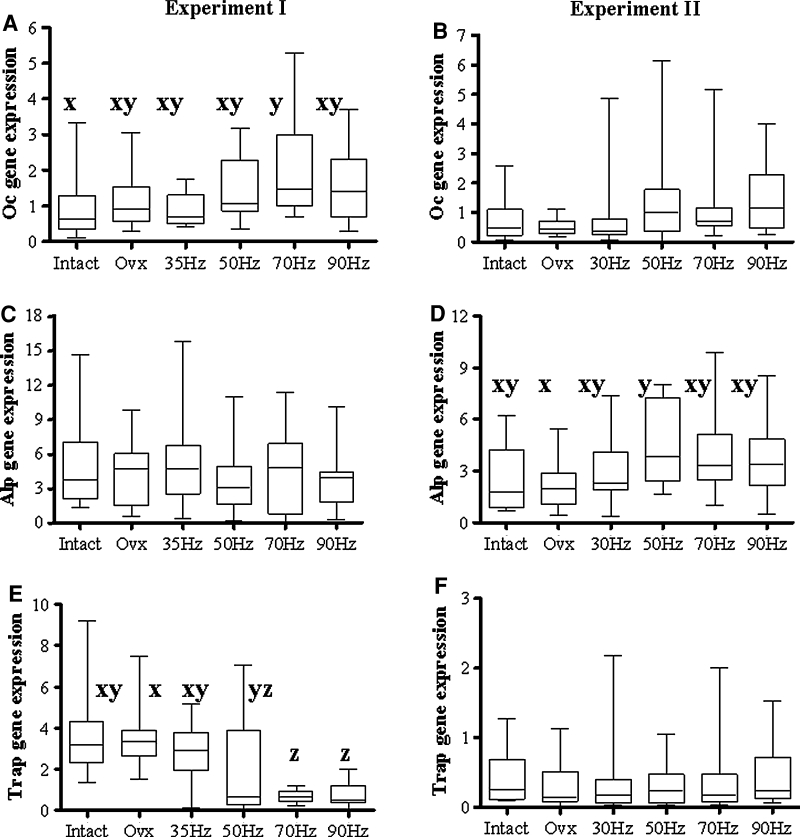
Fig. 3.
Box plot illustrating the relative mRNA expression level of a, b Oc, c, d Alp, and e, f Trap genes in OVX rats, either untreated or exposed to the vertical (first column, experiment 1) or horizontal (second column, experiment 2) vibration treatment, and intact rats, calculated using the 2−ΔΔCT method. Each treatment was conducted with at least 10 replications. Medians with different letters differ significantly (P < 0.05, Dunn test)

