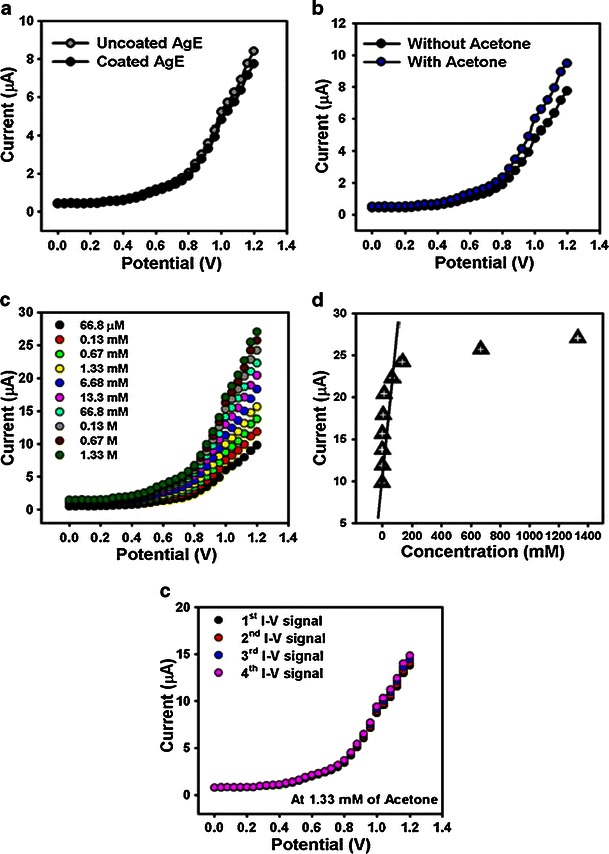
Fig. 4.

I-V responses of a un-coated and coated AgE; b without and with acetone (66.8 μM) in 10.0 mL phosphate buffer solution; c concentration variations (66.8 μM to 1.33 M) of acetone; d calibration plot (at +0.7 V), and e repeatability signals of ZnO-doped Co3O4 NRs fabricated on AgE surfaces. Potential was between 0.0 and +1.2 V
