
Figure 4.
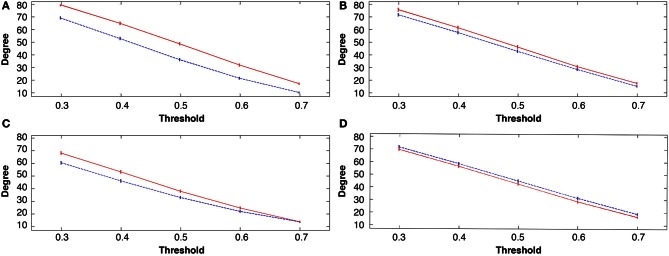
Group mean degree connectivity at all costs before and following the four tasks, in all figures rest 1 (pre-task in blue) and rest 2 (post-task in red); (A) explicit SRTT task 1; (B) implicit SRTT task 2; (C) visuo-motor learning task 3; (D) visuo-motor performance task 4. Mean is represented by the solid and dotted lines while vertical bars indicate SEM.