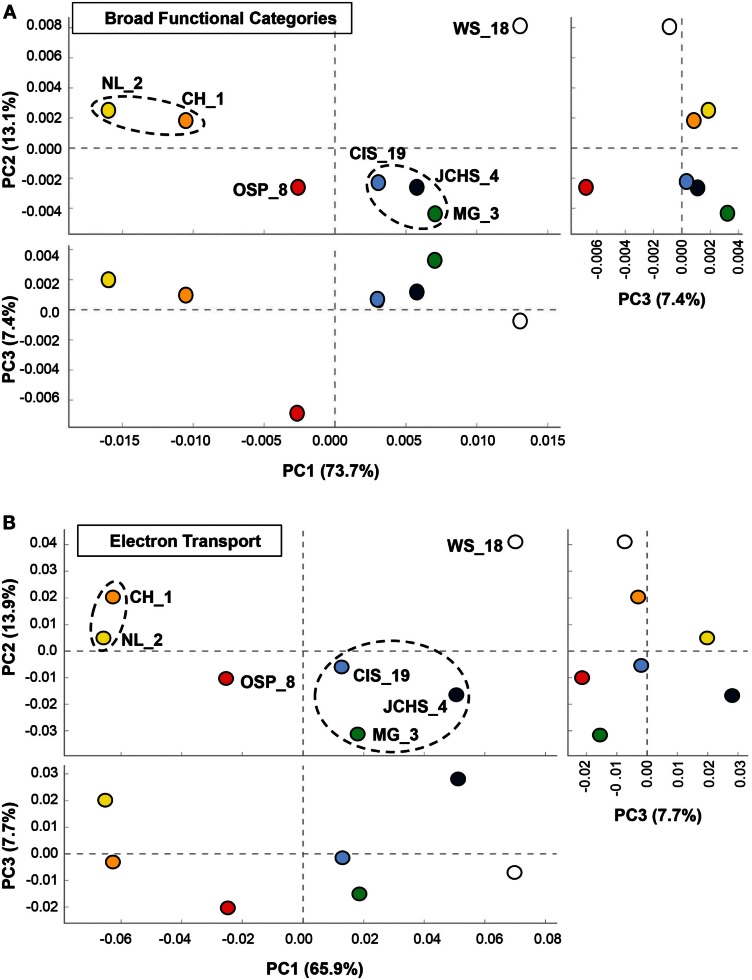
Figure 6.
Principal components analysis (PCA) of relative gene abundances across seven high-temperature archaeal-dominated chemotrophic communities. The three panels show pairwise plots of the first three principal components (PC1 and PC2 account for 76% of the variation across sites, while PC3 only represents ∼6%). (A) All TIGRFAMs grouped into functional categories, and (B). Only those TIGRFAMs associated with the role category “Electron Transport.” Sites are colored as before: Crater Hills (CH_1) = gold; Nymph Lake (NL_2) = yellow; Monarch Geyser (MG_3) = green; Joseph’s Coat Hot Springs (JCHS_4) = dark-blue; Cistern Spring (CIS_19) = light-blue; One Hundred Spring Plain (OSP_8) = red; Washburn Spring (WS_18) = open.

