
Figure 2.
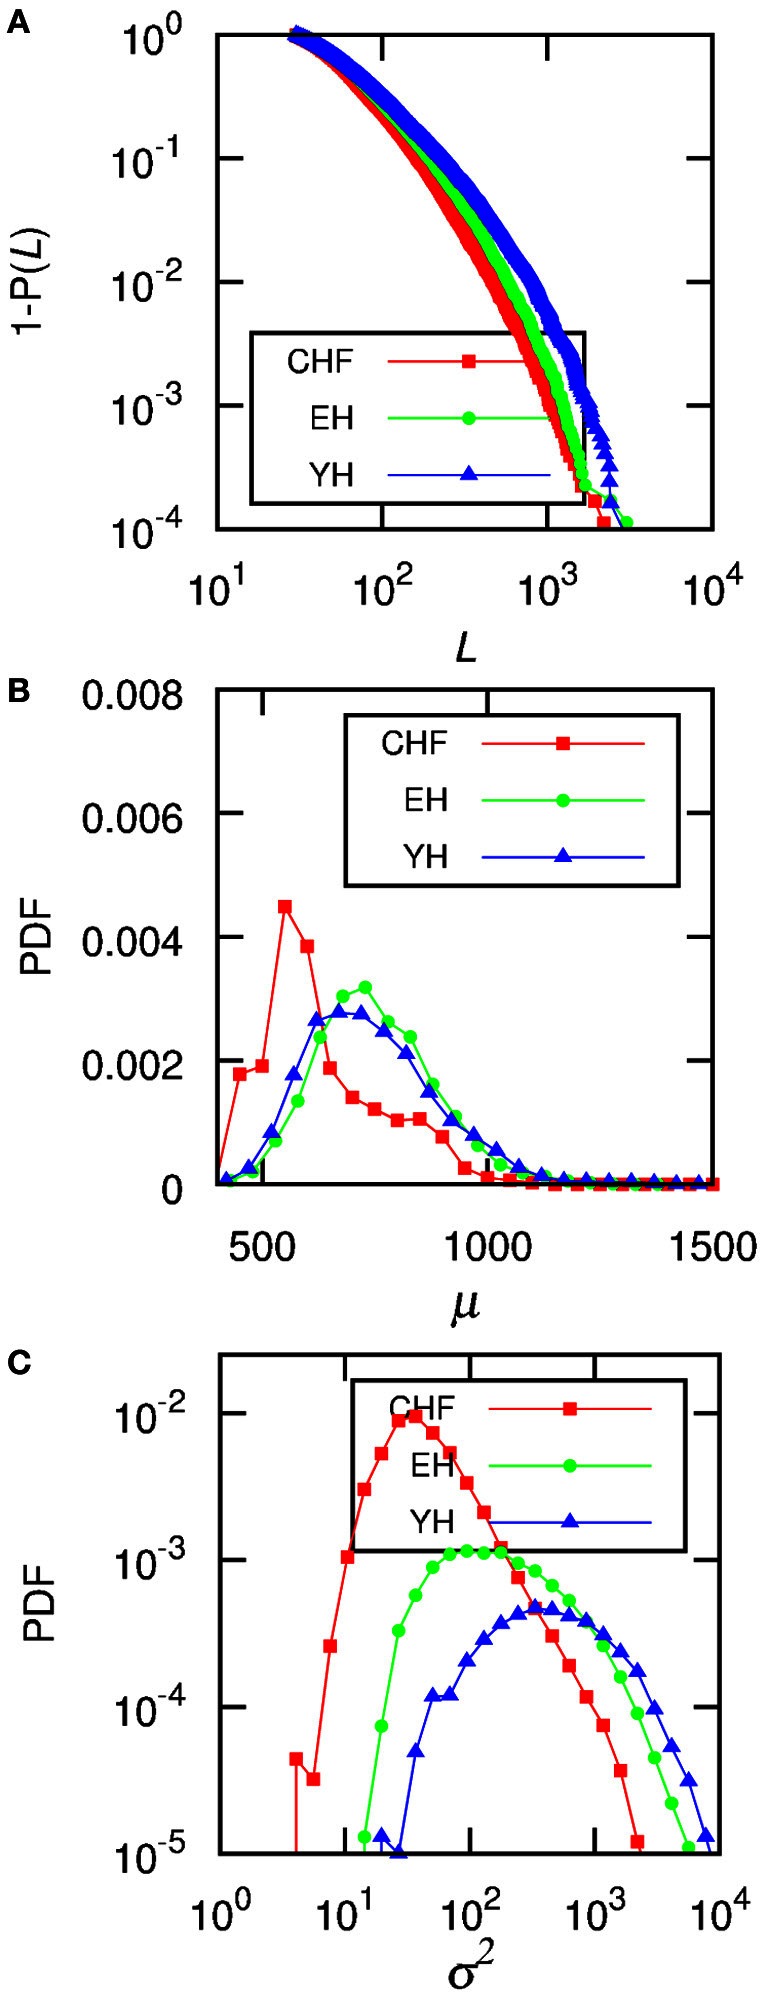
The data for all the subjects from each group were accumulated and (A) shows the complementary cumulative distributions of the size of each segment, L, (B) shows the distributions of the mean RR-interval, μ, of each segment, and (C) displays the distributions of the variance, σ2. The level of significance is P0 = 0.95, and the minimum segment size is ℓ0 = 30.