
Figure 4.
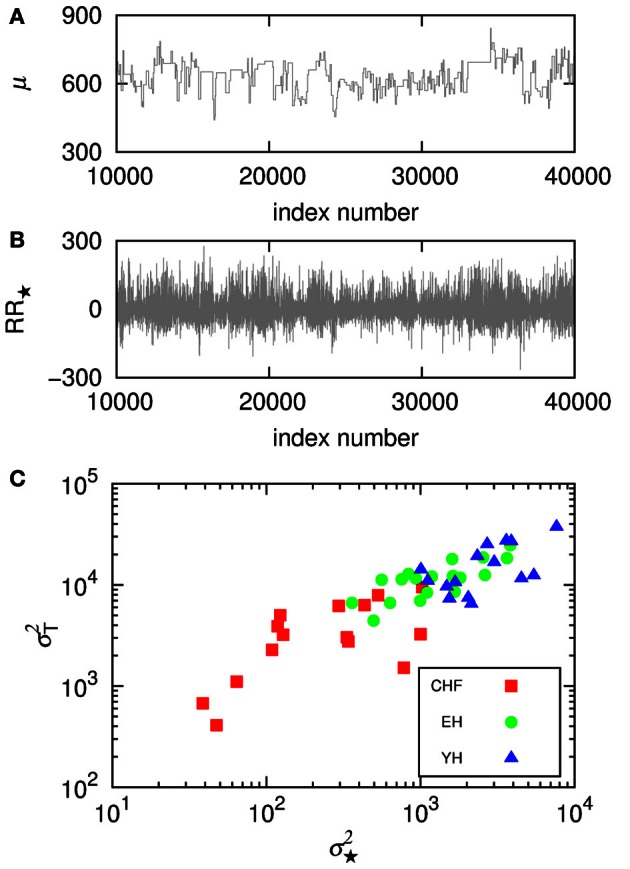
(A) Shows the trends given by the mean in the segments, μ, for a section of the segmented signal and (B) shows the signal RR⋆ resulting from the subtraction of the mean in each segment, μ. Then, (C) displays the variance in the detrended signal, σ2⋆, against the variance of the means, σ2T, for each subject.